The question of majority government will always be a key issue in Tasmanian elections because the Hare-Clark system of proportional representation makes the possibility of a hung parliament much more likely than in other states.
Adding extra interest to the next election (due sometime before September 2006) is the Liberals’ surprising (to many) declaration that they are not interested in minority government: for them, apparently, it is majority or nothing. (To view a copy of a document signed by all parliamentary Liberal members go to www.taslib.net and click on the policy document prompt in the left-hand corner.) So, what are their prospects of gaining that majority?
This paper uses two data sources - (i) the results from the last election held in 2002, and (ii) the Morgan Polls of voters’ first preference choice since then - and concludes that, if an election was held in August 2005, Labor would win 12 seats, the Liberals 8, the Greens 2 with 3 seats undecided. It then introduces a new measure, the election quotient, to assess the likelihood of various parliamentary outcomes. It finds that a Labor majority has an election quotient of .875, a hung result an election quotient of .125, and a Liberal majority an election quotient of zero.
Advertisement
It further calculates the election quotients for a series of swings should they occur on election day. It finds the following:

Finally the findings are considered in an historical context. The conclusion is that swings of the amount the Tasmanian Liberals need to gain even an outside chance of majority are twice to three times those achieved by any opposition party at an election in modern Australian political history.
Polls
The Morgan Poll is the only national polling company to regularly test the Tasmanian political climate, conducting a survey of voting intentions every four months. Local firm EMRS also undertake similar polling, however, their polls are not at regular intervals and the results tend to move around much more than Morgan. In addition EMRS usually interview about 20 per cent fewer respondents. The most recent EMRS poll, held in early August 2005, showed the following (after excluding those who were undecided): 50 per cent Labor; 29 per cent Liberals; 17 per cent Greens.
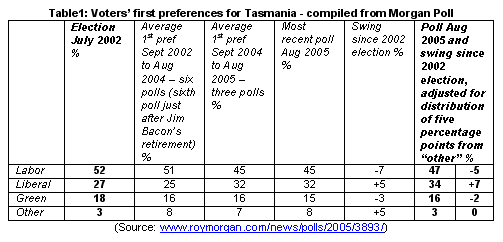
The Morgan Poll is used for this paper. Table 1 is a summary of those polls since the July 2002 election, the most striking feature being what might be called the “Jim Bacon factor”. The table suggests that voters withdrew 6-7 per cent support for Labor upon the retirement (and subsequent sad death) in mid-2004 of the immensely popular premier. Over a year has past and the Liberals have been unable to improve on the initial poll boost that event brought them.

Advertisement
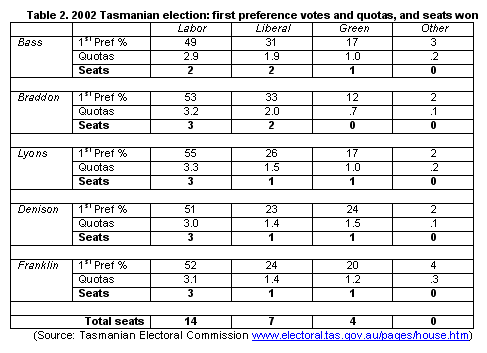
As Table 1 shows, as at August 2005 the Liberals have 32 per cent support, up 5 per cent on the 2002 election, Labor 45 per cent (down 7 per cent), the Greens 15 per cent (down 3) and “others” 8 per cent (up 5). The last election delivered Labor 14 seats and a majority in the 25 seat parliament, the Liberals 7 and the Greens 4, a quota being 16.7 per cent. So, on the face of it, 32 per cent support now gives the Liberals just on 2 quotas per electorate and notionally a possible return of 10 seats if an election was held today. But things are not that simple: historically the electorates have varied markedly in their party support profiles, so applying the poll results across the whole state is far too blunt a prediction tool. (Unfortunately Morgan do not provide an electorate by electorate breakdown.)

Swings
One way to gauge how the electorates might have voted is to apply, on an electorate-by-electorate basis, the swings revealed in the poll. For the purposes of this paper, these swings have been adjusted by distributing five percentage points from the “other” category to the parties’ August 2005 poll results. This is to remove the effect of the usual tendency in mid-term polls to show a higher than election day non-main party vote. The distribution has been made on a 2 Labor, 2 Liberal, 1 Green, basis which is simplistic, but well within reason for the purposes here. See the final column in Table 1 for the adjusted vote and swing. To complete the data set, Table 2 shows the results of the 2002 election in terms of first preference vote percentages, first preference quotas, and seats won.
Seats
Table 3 shows the outcome of applying the adjusted swings to the 2002 election results. The conclusion is that, if a hypothetical election was held today, Labor would win twelve seats, the Liberals eight, the Greens two, while three seats would be doubtful and not settled until after preference distribution. The explanation behind the seat allocation follows.
Bass
Both Liberal and Labor have over two quotas and therefore have at least two seats each, so it comes down to a battle for the fifth. The Liberals here are too far behind in the race to have a chance while the Greens’ Kim Booth almost has a party quota on first preferences and might just scramble home during the cut up; but Labor are still a strong chance on .63 of a quota if they receive the lions share of Liberal and “other” preferences, which history tells us they should. Far too close to call from the data here, so the fifth seat is doubtful.
Braddon
This electorate is straightforward on the data. Labor and the Liberals have enough for two seats each on primaries. In the preference cut up for the fifth seat Labor are far enough ahead of the Greens and Liberals to be certain of taking the seat. Final tally: three Labor, two Liberals.
Lyons
The Greens’ Tim Morris is holding .90 of a quota but he has on this data almost no chance of retaining his seat. The reason is that the Labor and Liberal vote falls just on the quota boundaries, three for Labor and two for Liberal, which means there would be relatively few cut up preferences to distribute, leaving Mr Morris stranded just short. Lyons, therefore, falls three seats to Labor and two to the Liberals.
Denison
With the awesome vote-pulling power of Jim Bacon no longer a factor, the Greens’ leader, Peg Putt, takes the mantle as the standout vote getter in Denison (her 2002 personal vote was nearly as much as the five Liberal candidates combined). The distribution of the Greens’ .32 of a quota surplus will decide whether the Liberals’ second candidate can stay ahead of Labor’s third, who is likely to be the incumbent David Bartlett. So on the data, it is two Labor, one Liberal, one Green and one doubtful between Labor and Liberal.
Franklin
A similar scenario to Denison where the Greens have enough for a seat and the preference distribution will decide who wins the fifth seat out of Labor and Liberal. Labor has the advantage of profile with their three Franklin members being ministers, including premier Paul Lennon, but the Liberals are marginally ahead on primaries. On the data, the tally is two Labor, one Liberal, one Green and one doubtful.

Election quotient
The next question to ask is, what are the mathematical probabilities for the various parliamentary outcomes once the doubtful seats are decided? These probabilities are presented in Table 4 as an election quotient, which is a decimal score out of a maximum of 1.0 which indicates the probability of a particular election outcome. A quotient of .5 (column A) is assigned to each party in each doubtful seat, then the product of various seat combinations (column B) are calculated to give a quotient for each possible outcome (column C). The quotients for each outcome combination are then summed to give the party’s final election quotient for gaining majority government (column D).

The conclusion is that, in a hypothetical election held today, a Labor majority would have an election quotient of .875 (or 87.5 per cent probability), a hung result an election quotient of .125 (12.5 per cent), and a Liberal majority an election quotient of zero.
Mountain to climb
Finally, this paper asks what swings might be needed for the Liberals to achieve the majority task they have set themselves. Running various scenarios through the model the following result were found (calculation sheets available on reasonable request):
- 10 per cent swing to the Liberals. Increasing the swing from 7 to 10 per cent results in an 11/10/2 outcome with two seats doubtful between Labor and Liberal. Labor would have to win both to gain a majority, so the election quotients are .25 for a Labor majority, .75 for a hung parliament, and zero for a Liberal majority;
- 12 per cent swing to the Liberals. The situation does not change with the added two per cent movement. The result is still 11/10/2 with the same probability quotients as those above;
- 15 per cent swing to the Liberals. The Liberals have to attract a swing their way in the mid teens before they start to see any chance of forming a majority. Now the outcome is 11/12/1 with the Greens’ seat in Franklin doubtful. For the first time the model predicts a three-way contest with all parties having close to an equal chance. The election quotient outcomes are .33 for a Liberal majority, .67 for a hung parliament, and zero for a Labor majority;
- 18 per cent swing to the Liberals. Even a swing in the high teens will not make majority a certainty for the Liberals. It gives a 10/12/1 result, with two seats doubtful. The probability quotients are .67 for a Liberal majority, .33 for a hung parliament, and zero for a Labor majority; and
- 20 per cent swing to the Liberals. At last a swing big enough to guarantee the Liberals a majority, but only just. The outcome would be 10/14/1 with no seats doubtful so the Liberals have an election quotient of 1.0 and are therefore 100 per cent assured of a majority.
To conclude, it is instructive to put the task ahead for the Tasmanian Liberals into a modern Australian political context. Over the past ten years, where Labor has come to power in all Australian states, the premierships of Steve Bracks, Mike Rann, Peter Beattie and Bob Carr were all achieved with modest swings. The best of the Labor victories was Jim Bacon’s in 1998 with a 4.3 per cent swing.
To put the task of modern day oppositions into sharper perspective, there have been 19 elections in Australian since 1995 (Western Australia and the Territories excluded because of lack of available data), with the largest swing recorded for a winning opposition party at any elections being 5.0 per cent (for John Howard’s Federal Coalition in 1996, which was considered a landslide).
Elections seemed somewhat more volatile in the 1970s and 1980s, although it is hard to find a swing to an opposition to win an election other than in single figures. There might have been one, but this researcher could not find it. Federal wins for Bob Hawke’s Labor in 1983 and Malcolm Fraser’s Coalition in 1975, both written up as modern day landslides, were won on swings of just over 7 per cent. On a state level, the standout appears to be the 1988 triumph by Nick Greiner’s Coalition in NSW, achieved with nearly a ten per cent swing, beating even the first “Wranslide” of the late 70s.
It is a fact that double-digit swings in favour of an opposition to win government are an extraordinary event in modern Australian political history. The Tasmanian Liberals not only have a mountain to climb, they have to be the first to climb it.