The period from 2012 to 2015 was Australia's 'dog days'. Our 'dog days' were when declining commodity prices led to a decline in the terms of trade. This decline in the terms of trade led to low nominal GDP growth. Low nominal GDP growth put tax revenue under great pressure. This meant expenditure needed to be tightly controlled to stop the budget balance blowing out.
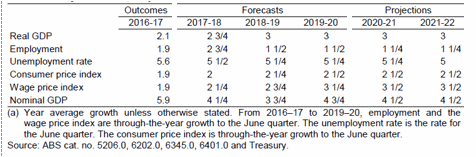
Figure 1: Major economic parameters
Advertisement
SOURCE: Budget Paper No 1, Table 2, Page 1-10
In Figure 1 above, we see the outlook for the Australian economy shown on Budget Paper No 1, Table 2, page 1-10. What is interesting here is the bottom line. That bottom line is nominal GDP. In previous commentary, we have noted that nominal GDP growth in our 'dog days' from 2012 to 2015 was really only around 2%. Nominal GDP is how wages are paid which meant that wage growth was pretty miserable. Nominal GDP is also how corporate profits are paid. This also meant that corporate profits were pretty miserable.
Nominal GDP (as shown in Figure 1) increased from around about the 2% figure in the previous three years to 5.9% in 2016-2017. This figure also shows that nominal GDP is expected to rise by 4.25% in 2017-2018. They expect it to increase by 3.75% in 2018-2019 and then 4.75% in 2019-2020. In the two years after that, nominal GDP continues to grow at 4.5%. The recovery in nominal GDP rescues Australia from its 'dog days'. Faster nominal GDP growth rescues us from the misery of that period. It also means that tax revenues are now rising at a pace where governments can fund things like individual tax cuts as long as they keep a steady line on budget expenditure.
We note from the Figure above that the government forecasts consumer price inflation to never rise above 2.5% and unemployment to never fall below 5%. Should that scenario actually occur, the Reserve Bank need not bother going to work again until sometime in late 2022.
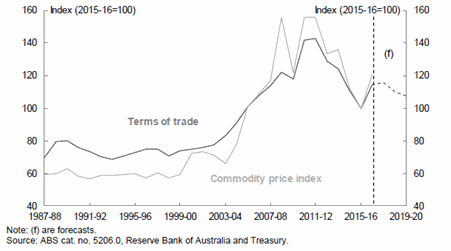
Figure 2: Commodity prices and the terms of trade
Advertisement
SOURCE: Budget Paper No 1, Chart 8, Page 2-24
In Figure 2, we see the reason that nominal GDP recovered. The real cause of our 'dog day' period was the decline in commodity prices and the decline in the Australian terms of trade from 2012 until 2015. It is this decline which inflicted low nominal GDP growth on the Australian economy.
Since the beginning of 2016, we have seen a sharp recovery in commodity prices. The RBA index of our export commodity prices has risen more than 20%. The terms of trade has had a similar but slightly smaller recovery. The Australian Treasury thinks that the terms of trade will drift down from now on. We have a whole lot of reasons including the expanding US budget deficit for thinking that Australian export commodity prices are going to be stable or continue to rise.
Figure 3: Nominal GDP Growth

SOURCE: Budget Paper No 1, Chart 7, Page 2-23
The effect of the recovery in commodity prices and the Australian terms of trade can be seen in Figure 3. This is drawn from Budget Paper No. 1, Chart 7, page 2-23. We can see the extremely low level of nominal GDP from 2012 to 2015. We can also see that the recovery in 2016-2017 merely took nominal GDP growth to around the long term average. The forecast for the future period is lower than this. We think this is just prudent budgeting. Higher growth levels might actually be achieved.
Where the money goes
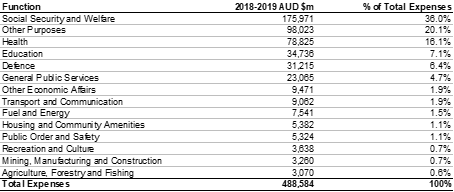
In Figure 4 below, we see expenditure outlined in Budget Paper No.1: Budget Strategy and Outlook 2018-19; Statement 6, Expenses and Net Capital Investment. This Budget proposes to spend a total of $488.6 billion. The largest section of spending by far remains Social Security and Welfare. This will consume $176 billion or 36% of total spending. Next comes Other Purposes. What you ask, is Other Purposes? This is the servicing of Australia's sovereign debt. It is the money we pay in interest for the national credit card. Spending here at $98 billion is bigger than every other sector of spending with the exception of one. This will consume 20% of budget expenditure.
Figure 4: Estimates of Australian General Government Expenses by Function
SOURCES: Budget Paper No.1: Budget Strategy and Outlook 2018-19 Statement 6, Expenses and Net Capital Investment; Morgans
Next comes Health which is expected to cost $79 billion or 16% of total spending. Following this is Education which should consume $35 billion or 7% of total spending. Defence follows with $31 billion or 6% of total spending. Transport and Communication spends $9 billion, or 1.9% of the total. Fuel and Energy spends $7.5 billion of the total. Other sectors spend even smaller amounts.
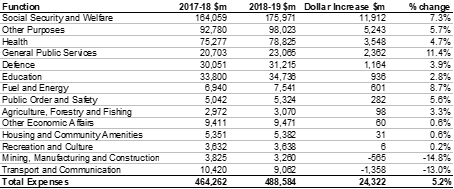
In Figure 5 below, we see expenditure outlined in Budget Paper No.1: Budget Strategy and Outlook 2017-18 & 2018-19; Statement 6, Expenses and Net Capital Investment. We see the estimated increases in Australian government spending by sector. We calculate these as the increase in the Budget for 2018-2019 over the budgeted expenditure a year ago in the Budget for 2017-2018.
Even in the time of controlled spending increases, there are still some areas which will receive significant increases. Fuel and Energy receives an increase of 8.7%. This is still a relatively small $601 million. Social Security on the other hand receives an increase of 7.3%. This is an awfully large $11.9 billion. Public Order and Safety receives an increase of 5.6% which amounts to a quote modest $282 million.
Figure 5: Estimates of Increases in Australian General Government Expenses by Function
SOURCES: Budget Paper No.1: Budget Strategy and Outlook 2017-18 & 2018-19 Statement 6, Expenses and Net Capital Investment; Morgans
What this Budget does
The centerpiece of this Budget is the provision of individual personal tax cuts. This is achieved through a seven year personal tax plan. This tax plan has three steps.
The first small step begins next year. Those earning up to $37,000 will have their tax reduced by up to $200. Those earning more than $37,000 will have their tax reduced by up to $530 per year. This is achieved by setting the threshold for the tax rate of 37 cents in the dollar at $90,000 on 1 July 2018.
The second step is that in 2022-2023 the lowest tax rate of 32.5% will be lifted to a threshold of $41,000. The tax rate of 37 cents in the dollar will come in at a higher level of $120,000.
The third step is in 2024-2025 when the 37% tax rate will be abolished. Australians earning more than $41,000 will only pay 32.5 cents in the dollar, all the way up to the top marginal tax rate which will be raised to $200,000.
The total cost of these tax cuts is shown as $13.4 billion. These tax cuts are possible because rising commodity prices have generated rising nominal GDP growth which is generated rising revenue.
Conclusion
The Australian economy has now emerged from its 'dog days'. During this period, falling commodity prices generated slow nominal GDP growth and slow government revenue growth. The only solution to this period was a tight control on spending.
A recovery in commodity prices and a rise in the terms of trade has now generated faster nominal GDP growth and faster government revenue growth. The government can now afford to return that faster government revenue growth to the voters in terms of prudent tax cuts.
Good luck is being accompanied by good management.
This article was first published by Morgans.
The information contained in this report is provided to you by Morgans Financial Limited as general advice only, and is made without consideration of an individual's relevant personal circumstances. Morgans Financial Limited ABN 49 010 669 726, its related bodies corporate, directors and officers, employees, authorised representatives and agents ("Morgans") do not accept any liability for any loss or damage arising from or in connection with any action taken or not taken on the basis of information contained in this report, or for any errors or omissions contained within. It is recommended that any persons who wish to act upon this report consult with their Morgans investment adviser before doing so. Those acting upon such information without advice do so entirely at their own risk.
This report was prepared as private communication to clients of Morgans and is not intended for public circulation, publication or for use by any third party. The contents of this report may not be reproduced in whole or in part without the prior written consent of Morgans. While this report is based on information from sources which Morgans believes are reliable, its accuracy and completeness cannot be guaranteed. Any opinions expressed reflect Morgans judgement at this date and are subject to change. Morgans is under no obligation to provide revised assessments in the event of changed circumstances. This report does not constitute an offer or invitation to purchase any securities and should not be relied upon in connection with any contract or commitment whatsoever.

 reddit this
 Seed Newsvine
 StumbleUpon
