Figure 3: Nominal GDP Growth

Advertisement
SOURCE: Budget Paper No 1, Chart 7, Page 2-23
The effect of the recovery in commodity prices and the Australian terms of trade can be seen in Figure 3. This is drawn from Budget Paper No. 1, Chart 7, page 2-23. We can see the extremely low level of nominal GDP from 2012 to 2015. We can also see that the recovery in 2016-2017 merely took nominal GDP growth to around the long term average. The forecast for the future period is lower than this. We think this is just prudent budgeting. Higher growth levels might actually be achieved.
Where the money goes
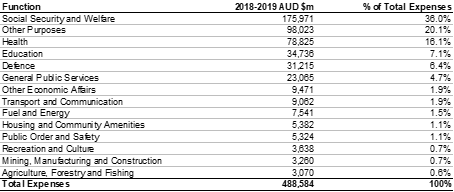
In Figure 4 below, we see expenditure outlined in Budget Paper No.1: Budget Strategy and Outlook 2018-19; Statement 6, Expenses and Net Capital Investment. This Budget proposes to spend a total of $488.6 billion. The largest section of spending by far remains Social Security and Welfare. This will consume $176 billion or 36% of total spending. Next comes Other Purposes. What you ask, is Other Purposes? This is the servicing of Australia's sovereign debt. It is the money we pay in interest for the national credit card. Spending here at $98 billion is bigger than every other sector of spending with the exception of one. This will consume 20% of budget expenditure.
Figure 4: Estimates of Australian General Government Expenses by Function
Advertisement
SOURCES: Budget Paper No.1: Budget Strategy and Outlook 2018-19 Statement 6, Expenses and Net Capital Investment; Morgans
Next comes Health which is expected to cost $79 billion or 16% of total spending. Following this is Education which should consume $35 billion or 7% of total spending. Defence follows with $31 billion or 6% of total spending. Transport and Communication spends $9 billion, or 1.9% of the total. Fuel and Energy spends $7.5 billion of the total. Other sectors spend even smaller amounts.
In Figure 5 below, we see expenditure outlined in Budget Paper No.1: Budget Strategy and Outlook 2017-18 & 2018-19; Statement 6, Expenses and Net Capital Investment. We see the estimated increases in Australian government spending by sector. We calculate these as the increase in the Budget for 2018-2019 over the budgeted expenditure a year ago in the Budget for 2017-2018.
This article was first published by Morgans.
The information contained in this report is provided to you by Morgans Financial Limited as general advice only, and is made without consideration of an individual's relevant personal circumstances. Morgans Financial Limited ABN 49 010 669 726, its related bodies corporate, directors and officers, employees, authorised representatives and agents ("Morgans") do not accept any liability for any loss or damage arising from or in connection with any action taken or not taken on the basis of information contained in this report, or for any errors or omissions contained within. It is recommended that any persons who wish to act upon this report consult with their Morgans investment adviser before doing so. Those acting upon such information without advice do so entirely at their own risk.
This report was prepared as private communication to clients of Morgans and is not intended for public circulation, publication or for use by any third party. The contents of this report may not be reproduced in whole or in part without the prior written consent of Morgans. While this report is based on information from sources which Morgans believes are reliable, its accuracy and completeness cannot be guaranteed. Any opinions expressed reflect Morgans judgement at this date and are subject to change. Morgans is under no obligation to provide revised assessments in the event of changed circumstances. This report does not constitute an offer or invitation to purchase any securities and should not be relied upon in connection with any contract or commitment whatsoever.
Discuss in our Forums
See what other readers are saying about this article!
Click here to read & post comments.
4 posts so far.

 reddit this
 Seed Newsvine
 StumbleUpon
