2. Long term performance Australian economy 1971-2025
Chart 1

Compiled from RBA Statistical Tables online
Advertisement
From Chart 1, the long-term trend line identifies long-term declining performance of the Australian economy between 1961 and 2025. Long-term economic decline can be explained only by structural change driven by political and economic philosophies of the various administrations.
Between 1961 and 2025, the Australian population, or domestic market, grew from10.5 million to 27.5 million or 162%. Whilst official unemployment data is not available for 1961, data from 1966 to 1970 is available in The Australian Year Book, 1971. Unemployment in Australia averaged 1.16% between 1966 and 1970 whilst the CPI averaged 2.23% between 1961-1969. Compare these figures with the basis of contemporary RBA applied monetarism that assumes NAIRU to be 4.6% with CPI measured inflation sitting between a 2%-3% range.
Another interesting impact upon Australian GDP performance is "climate change" policy that results from ratifying the Kyoto Protocol in 2007 and again committing to the second phase in 2012. From Chart 1, both the rate of change in GDP and real household disposable income slow down beyond these two points on respective curves. The percentage change in real household disposable income could easily constitute a trend line through the percentage change in GDP.
Change in a sectoral percentage represents structural change in an economy. In 1961, household consumption as a percentage of GDP was 58.9%, but remained relatively stable at 58.1% in 2001. In July 2000, the existing wholesale sales tax system was replaced with the GST. From 2001 onwards the household consumption curve begins a downwards slope from 58.1 to 48.7% of GDP post Covid in 2022. Some recovery occurs by 2024 as household consumption reaches 51% of GDP. Nevertheless, the contraction in household consumption from 2001 to 2022 represents a 16.18 % change in sectoral composition of the economy. The recovery to 51% in 2024 softens the sectoral change somewhat to 12.2 %
The important determinant of consumption expenditure is compensation of employees. From a peak of 57.5% in 1975, compensation of employees falls to 45.06% in 2024. That is a redistribution from employees to the wider economy of 21.6%. This redistribution of compensation of employees to other sectors of the economy renders the contemporary argument of productivity little more than an ideological slogan. The contraction of compensation of employees is consistent with the sectoral change in household consumption percentage of GDP
Changes in sectoral contributions to GDP have been from employees and households to other sectors: business, government, and net exports.
Advertisement
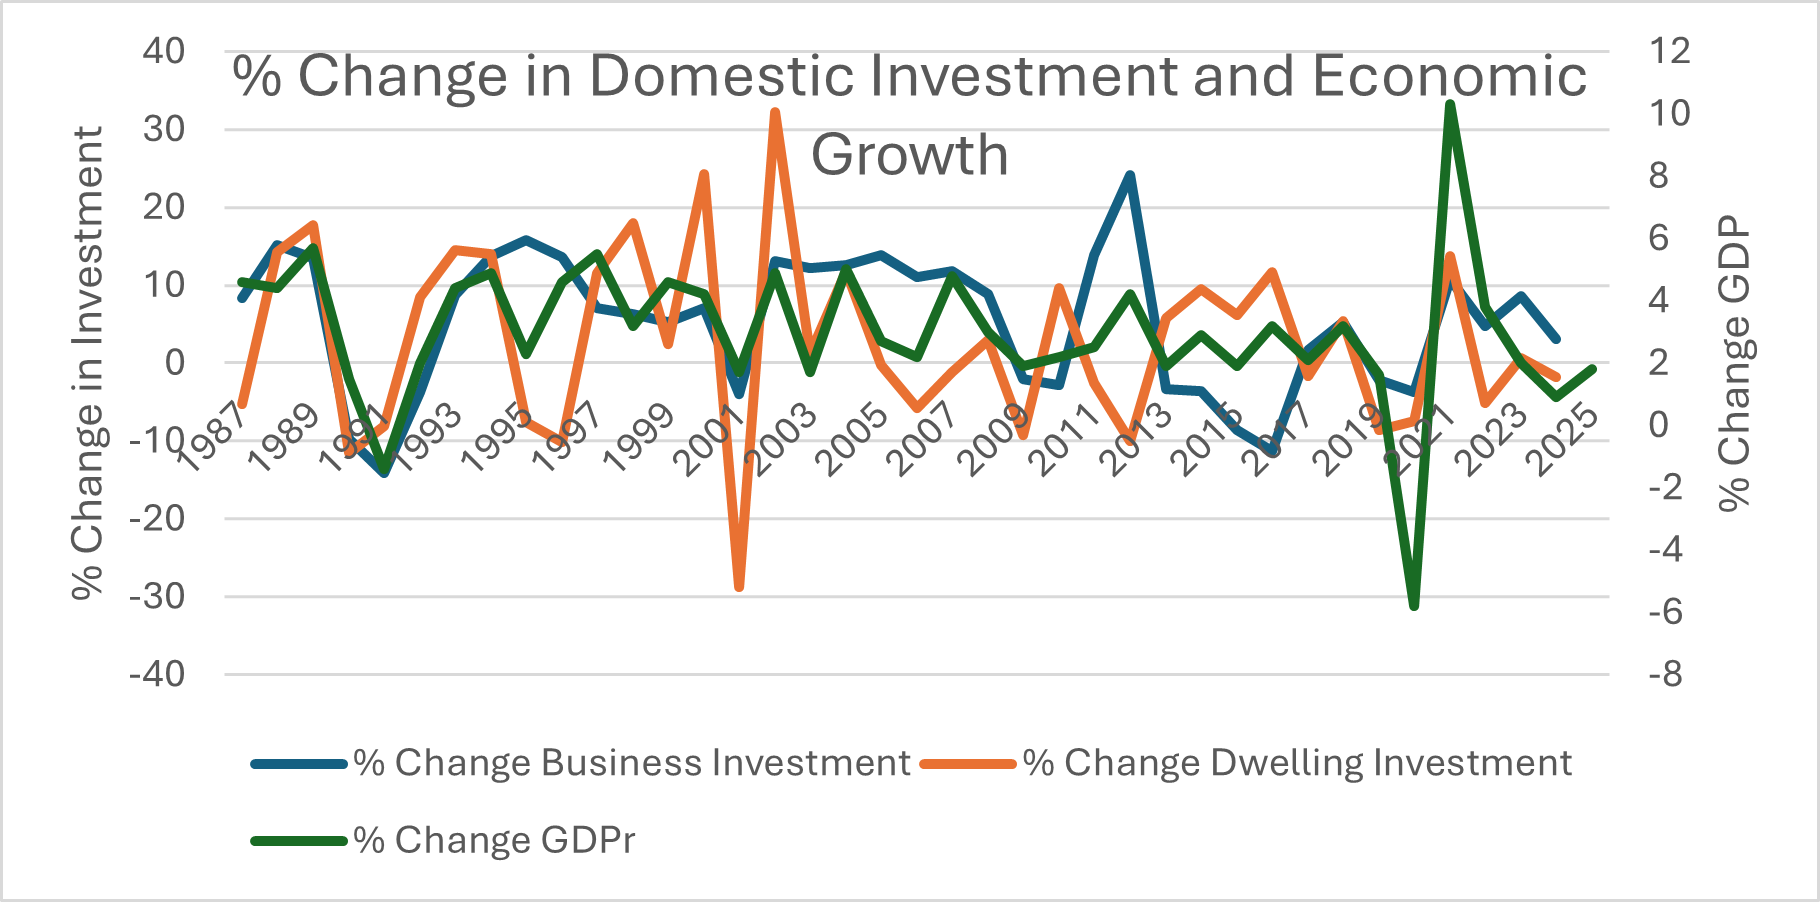
3. Economic growth and investment
"The underlying growth rate of the economy is determined by the rate of investment" " Paul Ormerod
Chart 2
Discuss in our Forums
See what other readers are saying about this article!
Click here to read & post comments.

 reddit this
 Seed Newsvine
 StumbleUpon