In 1971, declining faith in Keynesian demand management economics led to the breakdown of the post-World War II Bretton Woods international monetary system. An international system of free options replaced Bretton Woods.The free options system placed greater reliance upon Milton Friedman's monetarism, and neoclassical economics. Major structural change occurred to the economies of former Bretton Woods members as they adjusted to the new international monetary regime.
Looking back from 2025, this discussion examines structural change to the Australian economy post Bretton Woods collapse in 1971.
1. Structural reform
The Whitlam Labor Government elected in 1972, lead a progressive and reformist government that believed in an expanded role for the Federal Government in the fields of education, welfare, and urban planning. In his 1975 Budget speech, Treasurer Hayden confirmed Labor's change from the Keynesian post War era: "We are no longer operating in that simple Keynesian world in which some reduction in unemployment could, apparently, be purchased at the cost of some more inflation" .The underlying economic philosophy of the 1975 Treasurers speech approximated Friedman Phelps inflationary expectations theory already entrenched in the Australian Treasury. The Whitlam Government was defeated in 1975
Advertisement
Early In February 1975, the Liberal Party had circulated a monetarist document recommending restraint in monetary growth. Elected in November 1975, Malcolm Fraser's Liberal Government, committed to conservative values, embraced monetarism by introducing monetary targets in 1976. Over the late 1970's, there emerged a political term "the New Right" to describe the Fraser Administration. The "New Right" argued for monetarism, reduction in the size of government, privatisation of public services and enterprises, and deregulation of wage and labour markets. Supporters of the New Right movement comprised business groups, think tanks, farmer groups, sympathetic academics, politicians, and economists.
In 1976, The RBA introduced a new macro-economic model of the Australian economy which became known as RB76. In his book, Australian Monetary Policy 1950-1975, D.C Rowan describes RB76 as a relatively small neo-monetarist model as it emphasised the role of monetary disequilibrium. Although already established in the US and Britain, monetarist thinking had arrived in the Australian central bank.
On election of the Hawke/ Keating Government in 1983, significant structural reform of the Australian economy began. A right of centre corporatist economic system replaced the left of centre Keynesian system in which government enterprises competed with private enterprise particularly in the financial and transport sectors. In a corporatist economic system, Government decision making is structured around a limited number of decision-making institutions drawn from business, trade unions, professional, and farmer groups. Corporatist groups are thought to represent the important interests of individuals in society.
Under Hawke, exchange rate management became the responsibility of the monetarist RBA. Meanwhile fiscal policy and industry protection remained with the Government. Over the 1990's privatisation of public enterprises began. In 1991, Prime Minister Hawke issued a Budget document in which industry protection was either reduced or abandoned over a given time frame. Australia finally joined the international movement of "free options". The Australian economy became an open economy trading with the world.
In 1993, under Prime Minister Keating monetary policy became unofficially the responsibility of the RBA. The RBA adopted NAIRU as the basis of setting interest rates. NAIRU or Non-Accelerating Inflation Rate of Unemployment is an accepted alternative term for monetarisms natural rate of unemployment. In 1993, Prime Minister Keating replaced the awards based industrial system with enterprise bargaining. As Government retained management of fiscal policy in the open globalised economy, a monetarist/ neoclassical synthesis emerged as the basis of Australian macro-economic policy.
Elected in 1996, the Howard Government officially confirmed the independence of the RBA to manage monetary policy. John Howard, noted for New Right beliefs, changed industrial relations with the introduction of the Workplace Relations Act which introduced enterprise bargaining between an employer and employees. In 2005, this Act was amended to establish a national wage system of enterprise bargaining. The 2005 Act became known as Work Choices.
Advertisement
With the inclusion of the "Australia Clause 3.7", Prime Minister Howard signed the Kyoto Protocol in 1998. Howard did not ratify Kyoto as it was thought climate policy could cost Australian jobs. In 2007, the Rudd Labor Government ratified the Kyoto Agreement. In 2011, the Gillard Labor Government introduced the Clean Energy Act and introduced a carbon tax. In 2012, Prime Minister Gillard committed Australia to the second phase of Kyoto.
Faced with Covid, in 2020, the RBA began quantitative easing buying $80B Commonwealth Securities and $ 20B State and Territory Securities. Monetary management was considered necessary to fund government assistance programs necessary to provide support to communities, business, and individuals affected by Covid policies. In March 2022, the RBA ceased quantitative easing and began quantitative tightening which involved selling securities to shrink the money supply.
From Bretton Woods to Covid, the Australian economy and its citizens have faced structural change experienced previously only in times of Depression and World Wars. This discussion attempts to bring some structure to a discussion lost in political and economic ideologies from the past.
2. Long term performance Australian economy 1971-2025
Chart 1

Compiled from RBA Statistical Tables online
From Chart 1, the long-term trend line identifies long-term declining performance of the Australian economy between 1961 and 2025. Long-term economic decline can be explained only by structural change driven by political and economic philosophies of the various administrations.
Between 1961 and 2025, the Australian population, or domestic market, grew from10.5 million to 27.5 million or 162%. Whilst official unemployment data is not available for 1961, data from 1966 to 1970 is available in The Australian Year Book, 1971. Unemployment in Australia averaged 1.16% between 1966 and 1970 whilst the CPI averaged 2.23% between 1961-1969. Compare these figures with the basis of contemporary RBA applied monetarism that assumes NAIRU to be 4.6% with CPI measured inflation sitting between a 2%-3% range.
Another interesting impact upon Australian GDP performance is "climate change" policy that results from ratifying the Kyoto Protocol in 2007 and again committing to the second phase in 2012. From Chart 1, both the rate of change in GDP and real household disposable income slow down beyond these two points on respective curves. The percentage change in real household disposable income could easily constitute a trend line through the percentage change in GDP.
Change in a sectoral percentage represents structural change in an economy. In 1961, household consumption as a percentage of GDP was 58.9%, but remained relatively stable at 58.1% in 2001. In July 2000, the existing wholesale sales tax system was replaced with the GST. From 2001 onwards the household consumption curve begins a downwards slope from 58.1 to 48.7% of GDP post Covid in 2022. Some recovery occurs by 2024 as household consumption reaches 51% of GDP. Nevertheless, the contraction in household consumption from 2001 to 2022 represents a 16.18 % change in sectoral composition of the economy. The recovery to 51% in 2024 softens the sectoral change somewhat to 12.2 %
The important determinant of consumption expenditure is compensation of employees. From a peak of 57.5% in 1975, compensation of employees falls to 45.06% in 2024. That is a redistribution from employees to the wider economy of 21.6%. This redistribution of compensation of employees to other sectors of the economy renders the contemporary argument of productivity little more than an ideological slogan. The contraction of compensation of employees is consistent with the sectoral change in household consumption percentage of GDP
Changes in sectoral contributions to GDP have been from employees and households to other sectors: business, government, and net exports.
3. Economic growth and investment
"The underlying growth rate of the economy is determined by the rate of investment" " Paul Ormerod
Chart 2
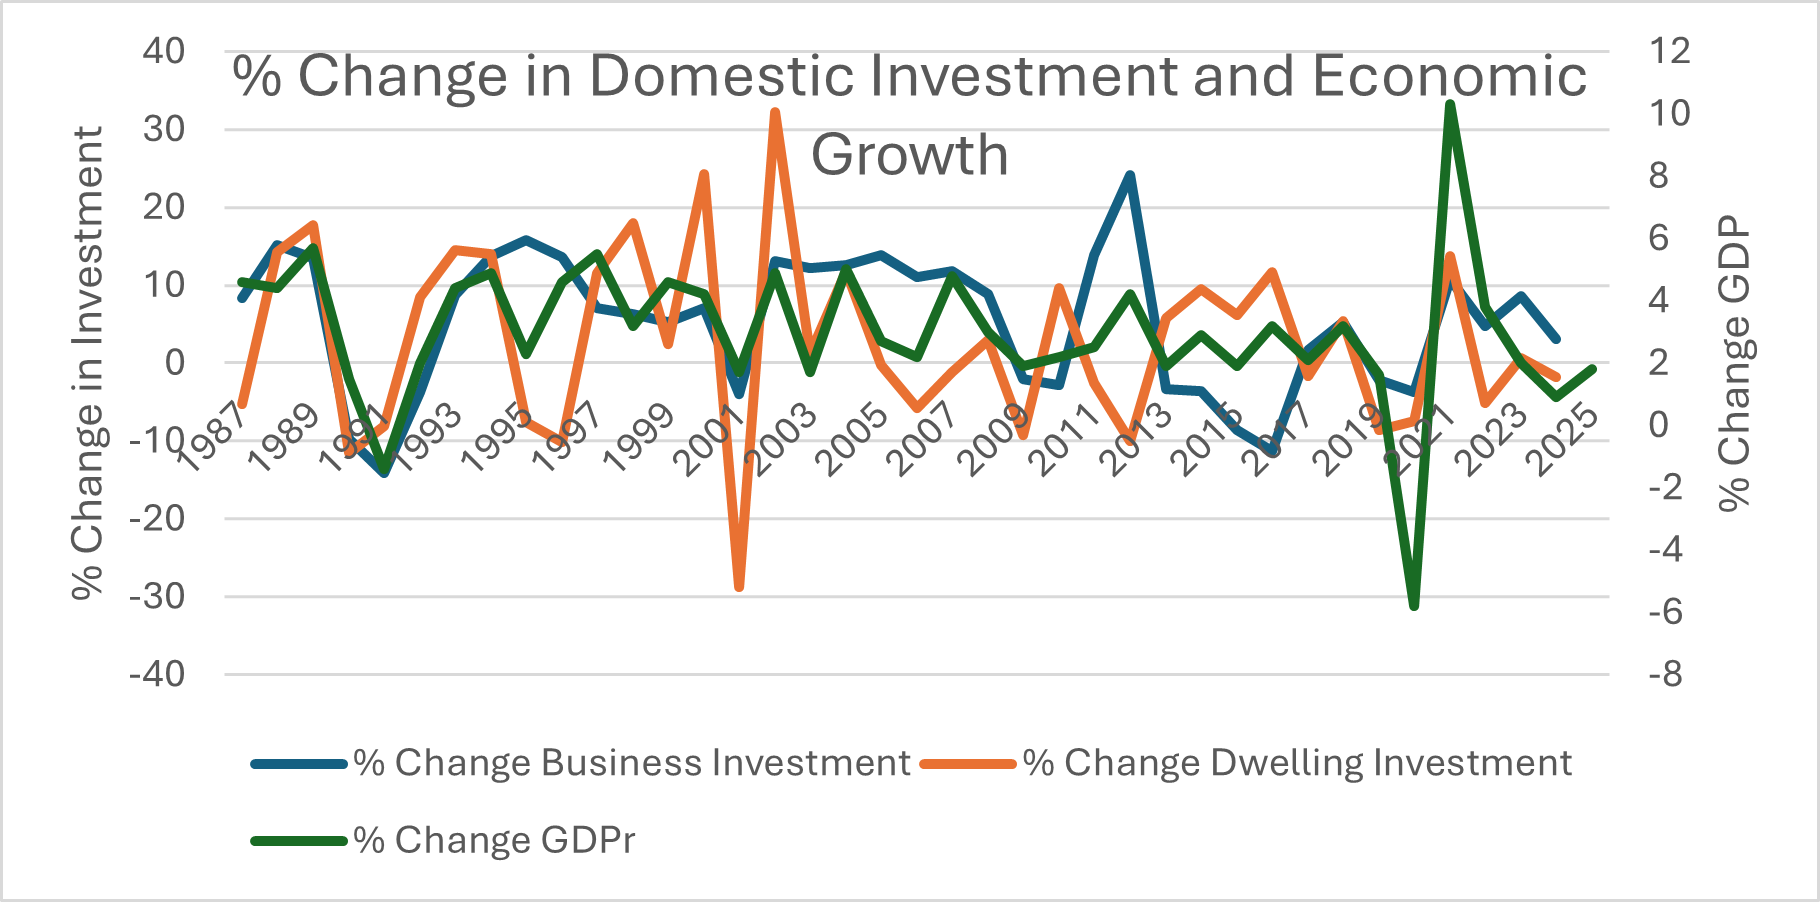
Post World War II, the level of investment drove economic growth for almost three decades. Chart 4 illustrates the importance of investment to Australian economic growth from 1987 to 2025 which encompasses structural reform. Business investment peaks at 15.8% of GDP in 1995; but, except for an extraordinary peak in 2012, business investment steadily declines.
Dwelling investment peaks in 2003; but its contribution to economic growth continues to contract. In face of this long-term decline in housing investment, the contemporary debate over a housing crisis demonstrates a decline in the standard of contemporary economics.
Chart 3

Compiled from RBA Statistical Tables online
Chart 3 illustrates structural change in the composition of employment between full time and part time employment as economic growth declines. Full -time employment has fallen from 84.5% of employment in1978 to 68.9% in 2024. Meanwhile, part time employment over the same period increases from 15.4 % to peak at 31.6% in 2019.
Amongst part time employees are workers seeking more hours of work than are available in their normal workplace. These employees are referred to as multiple job holders. In 2025, the ABS identifies 948, 980 multiple job holders or 6.4% of the work force. The distribution of employment and income is clearly a major policy issue.
4. Structural change Australian economy
Structural change in the Australian economy can be estimated by plotting the openness of the economy. The openness of an economy is the sum of exports plus imports expressed as a percentage of GDP. The remaining percentage becomes the domestic sector of an economy.
Chart 4

Compiled from RBA Statistical Tables online
Opening the Australian economy to globalised markets trading freely was never a costless exercise conferring unlimited benefits. Accompanying trade liberalisation was financial liberalisation in which Australians invested in overseas markets whilst overseas investors took advantage of Australian investment opportunities. Put simply, Australians earned investment income offshore whilst overseas investors earned income in Australia. The net income flow between overseas income earned by Australian investors and international investors in Australia becomes the current account entry "Net Income Deficit" which can be found in RBA Statistical Table I5.
In Chart 4, Net Income deficit is shown as a positive figure to simplify interpretation of its importance in the calculation of GDP. Chart 4 shows empirically that globalisation of investment has not been costless to ordinary Australians. Indeed, beyond 1997 growth in GDP begins to trend downwards as openness increases. From 2003 onwards, Net Income Deficit becomes a liability to the underlying performance of the Australian economy. This is particularly obvious in recovery from Covid.
5. Conclusions
Graphical evidence demonstrates that post 1971 structural reform of the Australian economy under a monetarist neoclassical synthesis has not served well the Australian economy and its people. Internationally, President Trump is moving to expunge the failed economic philosophies from US policy. The reality of President Trump's actions are exposing the lack of economic knowledge that has emerged worldwide as the monetarist neoclassical model became entrenched in western democracies.
Australia needs to redress that loss of knowledge domestically. Concentrated, Informed, and intelligent economic debate must be structured for Australia to move forward in a new philosophical direction.

 reddit this
 Seed Newsvine
 StumbleUpon