Between 8 and 9 out of ten of all metropolitan region jobs are in suburban locations (not CBDs). This tends to be widely dispersed at densities up to around 500 jobs per square kilometre, rising to over 2,000 and 3,000 per square kilometre and more in some areas. While the suburbs represent the overwhelming majority of jobs, they also tend to be lower paid than the jobs found in CBDs and inner city areas which can earn on average between 50% and 100% more than suburban jobs. So while the CBDs and inner cities are minority employers, they are employment locations of relative financial privilege, concentrated in small geographic areas.
What I want to look at here is how the demography of employment influences the commute.
The top 10 locations Australia wide for public transport commutes to work are all CBD and inner city locations. Topping the list is the Sydney CBD, Haymarket and the Rocks, with 67.7% of workers there using public transport. Next are workers in the Melbourne CBD, with 57.8% using public transport, followed by workers in Brisbane CBD, with 56.1% of workers there using public transport.
Advertisement
Reading on through the top 10 reads like a list of some of the more privileged or rapidly gentrifying workplace locations in the country: North Sydney/Lavendar Bay (52.6%), Surry Hills (49.2%), Docklands Melbourne (47.9%), East Melbourne (41.3%), Pyrmont-Ultimo (40.6%), Perth City (39.6%) and Redfern-Chippendale (37.2%).
The top 25 employment locations for public transport use paint a similar picture (click on the table to enlarge):
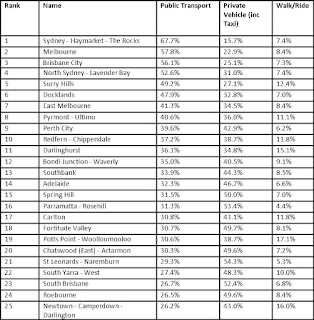
By and large, these are all mainly inner city locations. While the proportions making use of public transport to work in these areas is high, the same areas represent only a minority of 10% to 15% of metropolitan wide jobs. Plus, these are jobs which earn, on average, a great deal more than suburban employment. In short, the highest rates of public transport use are found amongst the minority of workers who earn the most money.
The converse is also true. Suburban employment centres, where the vast majority of jobs are located, are reliant on private vehicle. Here's a selection: North Parramatta – 10% by public transport, 74% by private vehicle; Carindale (Brisbane) – 9.6% by public transport, 60.4% by private vehicle; Maribyrnong (Melbourne) – 8.5% by public transport, 68% by private vehicle. These are typically locations where public transport options are limited: it's simply too expensive to contemplate servicing lower density suburban employment this way. Workers with jobs in these locations are not choosing the private car, they are relying on it. It's not a 'love affair' but a necessity.
Visually, the picture is stark. The illustration below (taken from a site called 'Charting Transport' which is full of useful analysis – this particular illustration is from this article) shows clearly that public transport is typically a mode of choice for CBD and inner city workers and almost of no use to workers in middle or outer suburbs.
Advertisement

It's the same pattern repeated across other metropolitan regions. The parts in red or orange are where the majority of workers are, the parts in green where a minority of higher paid workers are.
This point doesn't need labouring but the implications take some explaining. Public transport systems are heavily subsidised by taxpayers. Yet the highest patronage is amongst the minority of workers who earn the most money. Private transport receives no such subsidy and, as motoring bodies point out, it raises more money through registration fees and fuel taxes than is spent on it. Private transport –namely the car – is the only practical mode of choice for the majority of workers in suburban economies, where they tend to earn less. The reality is that suburban workers on lower incomes with limited access to public transport as an option are subsidising the public transport systems used by inner city workers on higher incomes.
The author is indebted to Urban Economics for their research assistance in pulling these figures together. There aren’t too many questions this company can’t answer, so if these articles raise any particular questions in your mind, please contact Kerriane Bonwick on kerrianne@urbaneconomics.com.au or phone them on (07) 3839 1400.
Discuss in our Forums
See what other readers are saying about this article!
Click here to read & post comments.
8 posts so far.


 reddit this
 Seed Newsvine
 StumbleUpon