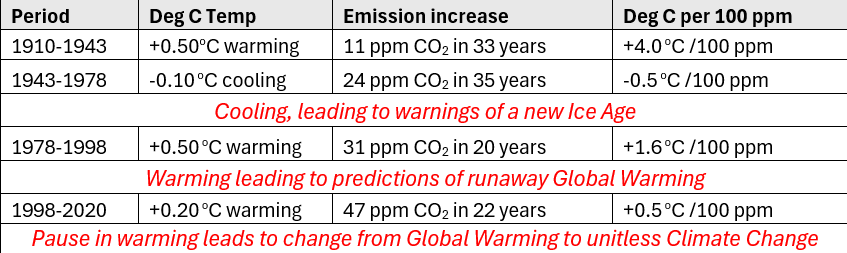
The righthand column in the above table shows the change in temperature for each of the four periods per 100ppm of emissions, there is no correlation.
Advertisement
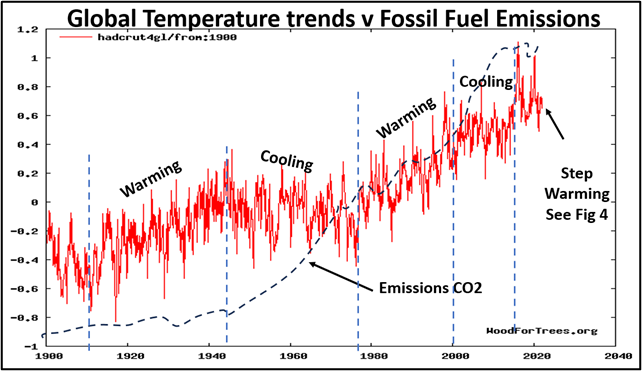
Fig 3: Global Sea Surface Temperatures and Atmospheric CO2post 1900. Source: https://www.woodfortrees.org/plot/hadcrut4gl/from:1900
The Pause followed the 1998 El Niño, and temperatures showed no increase until the El Niño of 2016, which was followed by two further warming events separated by another plateau (Fig 4). None of these events show any correlation with the steady increase in atmospheric CO2 (green dashed line).
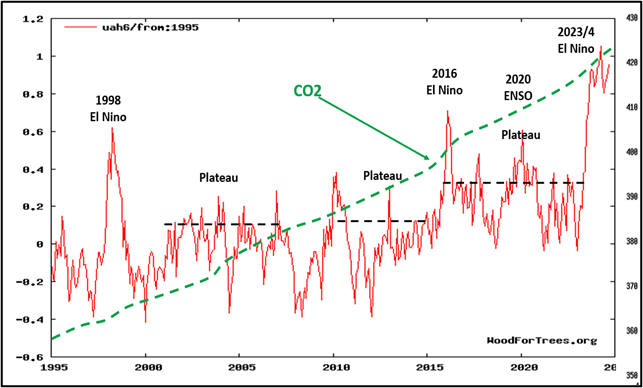
Fig 4: Global Sea Surface Temperatures and Atmospheric CO21995-2024. Source: https://climate4you.com/
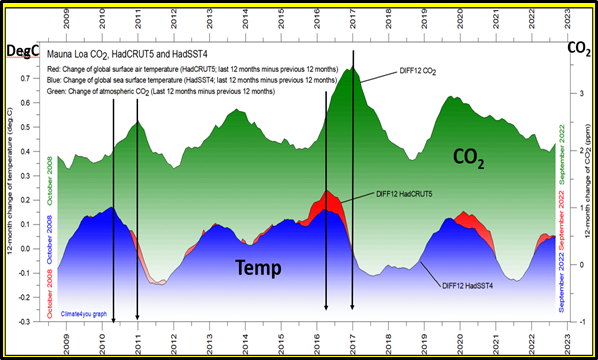
These variations in Global Temperature are not being driven by the increasing atmospheric CO2 content, something further confirmed by the regular lag between global temperature changes and atmospheric CO2 concentrations over time (Fig 5). The graph below shows the year-on-year changes in annual temperature (Blue & Red) and CO2 (green), not the actual temperature reached. The peak temperature increase associated with the 2016 El Niño occurs some 11 months prior to the peak in atmospheric CO2, and does so throughout the period of record at Mauna Loa. For human emissions of CO2 to be the driver of Global Warming one would expect atmospheric CO2 concentrations to increase before global temperatures.
Advertisement
Fig 5: Global Sea and Land temperature anomalies versus atmospheric CO2anomalies. Source: https://climate4you.com/
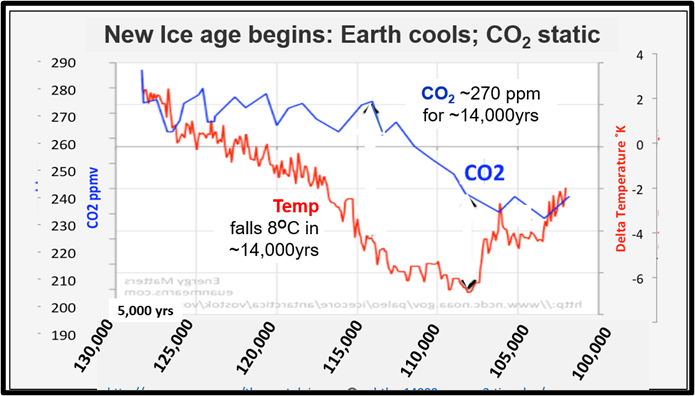
Looking further back in time the available evidence shows that changes in atmospheric CO2 always follow, or ignore changes in temperature. During each of the past Pleistocene glaciations, as the warm interglacial ends and cooling begins atmospheric CO2 can remain at high at around 270 ppm for up to 14,000 years, while global temperatures fall by as much as 8O C (Fig 6). This pattern was repeated in all of the last four Ice Ages, with the lag varying between 7,000 and 14,000 years.
Discuss in our Forums
See what other readers are saying about this article!
Click here to read & post comments.
9 posts so far.

 reddit this
 Seed Newsvine
 StumbleUpon
