We have to cut emissions to save the planet, has become the mandatory go to phrase in any discussion about 'Climate Change', but do we really? The history of human emissions from primarily fossil fuels since James Watt invented the steam engine in 1769, shows no evidence that would support such a conjecture. If human emissions of CO2, which are largely from fossil fuels, cause global warming, there should be a clear correlation between them but, as this note will demonstrate, there is not. And, while correlation does not prove causation, a lack of correlation must overturn any hypothesis or conjecture.
Cumulative fossil fuel emissions of CO2 had only reached 1ppm (Fig 1) by ~1860, when Alpine Glaciers began to retreat (Fig 2). Since that time, atmospheric CO2 has increased by some 122 ppm and the glaciers have continued to retreat, but they are still there.

Advertisement
Fig 1: Fossil Fuel emissions from 1750 to 2024
The retreat of glaciers globally, signalled the end of the Dickensian Little Ice Age (LIA), and if this was caused only by human emissions, we should be very grateful, because the early 19th century was a period of failed crops, mass starvation and premature deaths. However, it is more likely that the warming was a response to the increase in solar output that ended the LIA, rather than to the paltry 1 ppm of emissions.
The continuing glacial retreat was not uniform, which could be expected if it was driven by the gradual increase in CO2 emissions, so the three advances after 1860 were presumably in response to cooling.

Fig 2: Alpine Glacier Advance & Retreat from 1550 Source: http://www.geo.uzh.ch/~snus/publications/nussbaumer_zumbuehl_2012.pdf
By 1900 cumulative emissions had still only reached 6 ppm, and by 1930, at the beginning of the warm period that brought dustbowl conditions to the USA and elsewhere, they were just 9 ppm. But even this figure is misleading, as around half of human emissions are sequestrated by the biosphere and oceans, leaving only a 4-5 ppm addition to the atmosphere (Figs 1 & 3). Was that enough to drive the warming which continued until ~1943, and how can it explain the cooling that followed (Fig3) for the next 35 years?
Advertisement
Fossil Fuel emissions only began to rise significantly from around 1956 (Fig 1), during what had been called the Nuclear Winter, when consensus science was predicting a new Ice Age (Fig3). Then, from 1978, global temperatures began to rise more in line with the increase in atmospheric CO2 and Global Warming became the new consensus.
Then a 'catastrophe' called 'The Pause', saw temperature rise stalling from 2000, despite continually increasing emissions, and Climate Change, which has no recognisable units that can be easily measured, was born.
The following chart (Fig 3) shows global Sea Surface Temperatures (red) and CO2 emissions and shows there have been two periods of strong warming (from 1910-1943 and 1978-2000) and two of cooling or no warming (from 1943 -1978 and 2000 to 2016) during which fossil fuel and other human emissions were always increasing.
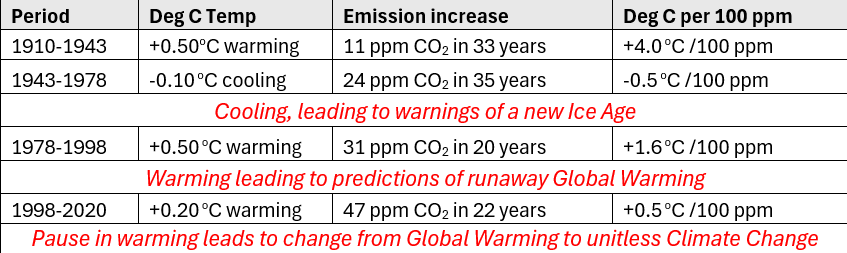
The righthand column in the above table shows the change in temperature for each of the four periods per 100ppm of emissions, there is no correlation.
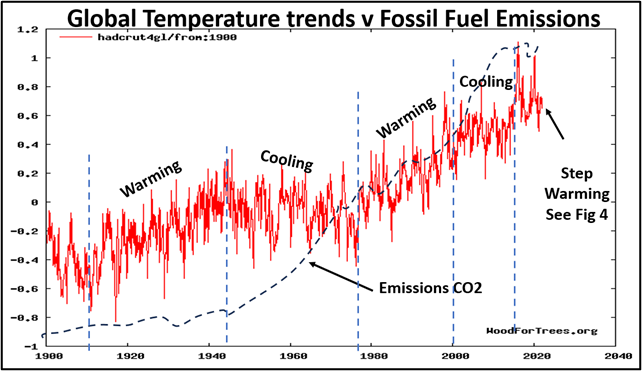
Fig 3: Global Sea Surface Temperatures and Atmospheric CO2post 1900. Source: https://www.woodfortrees.org/plot/hadcrut4gl/from:1900
The Pause followed the 1998 El Niño, and temperatures showed no increase until the El Niño of 2016, which was followed by two further warming events separated by another plateau (Fig 4). None of these events show any correlation with the steady increase in atmospheric CO2 (green dashed line).
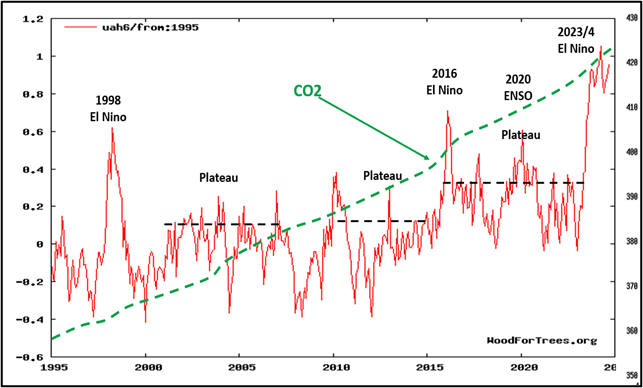
Fig 4: Global Sea Surface Temperatures and Atmospheric CO21995-2024. Source: https://climate4you.com/
These variations in Global Temperature are not being driven by the increasing atmospheric CO2 content, something further confirmed by the regular lag between global temperature changes and atmospheric CO2 concentrations over time (Fig 5). The graph below shows the year-on-year changes in annual temperature (Blue & Red) and CO2 (green), not the actual temperature reached. The peak temperature increase associated with the 2016 El Niño occurs some 11 months prior to the peak in atmospheric CO2, and does so throughout the period of record at Mauna Loa. For human emissions of CO2 to be the driver of Global Warming one would expect atmospheric CO2 concentrations to increase before global temperatures.
Fig 5: Global Sea and Land temperature anomalies versus atmospheric CO2anomalies. Source: https://climate4you.com/
Looking further back in time the available evidence shows that changes in atmospheric CO2 always follow, or ignore changes in temperature. During each of the past Pleistocene glaciations, as the warm interglacial ends and cooling begins atmospheric CO2 can remain at high at around 270 ppm for up to 14,000 years, while global temperatures fall by as much as 8O C (Fig 6). This pattern was repeated in all of the last four Ice Ages, with the lag varying between 7,000 and 14,000 years.
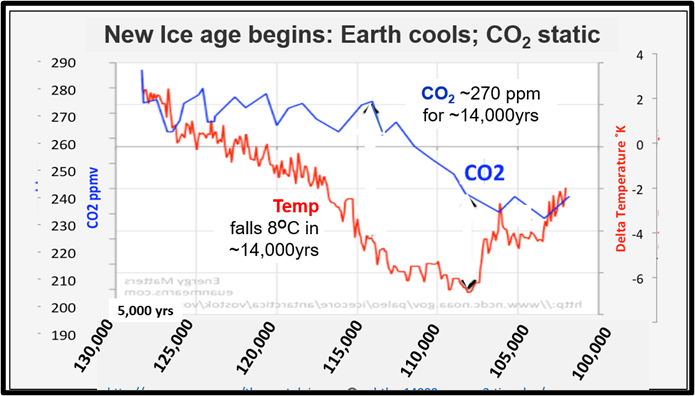
Fig 6: Temperatures fall while CO2 stays constant at 270ppm. Source: http://euanmearns.com/the-vostok-ice-core-and-the-14000-year-co2-time-lag/
Even further back in time the 600 million years plus record of the rocks that make up our landscape, consistently show that changes atmospheric CO2 either follow or sometimes (Fig 6) ignore changes in global temperatures. A global ice age for example occurred some 435 million years ago towards the end of the geological period of time known as the Ordovician with atmospheric CO2 concentrations of well over 4,000 ppm, that is almost ten times today's miserly 422 ppm.
With such a complete absence of correlation, it seems that we should not worry about our fossil fuel emissions. So, we can be confident that the just over 1O C of Global Warming that has occurred since 1750, or 1850, was not caused by the ~140ppm increasing in atmospheric CO2 concentrations (and which is roughly double the human emissions, as noted above). Reducing emissions would not reduce current atmospheric concentrations, but could curtail the increase in crop yields, and the greening of the biosphere that has occurred since atmospheric concentrations exceeded their previous ice age maximum of 280-300 ppm.
Net Zero is a pointless and destructive target, and CO2 emissions do not need to be curtailed, nor does CO2 need to be 'captured' and buried underground.

 reddit this
 Seed Newsvine
 StumbleUpon
