One proposed solution is to catch and dispose of emitted CO2 before it gets into the atmosphere. Carbon Capture and Storage (CCS) is an old idea dating back to the 1970s. It has been made to work in small operations. But scale is the challenge. In volume and mass these emissions exceed even those of their sources, the initial fossil fuels. That is, there's more waste than starting material. CCS represents the greatest conceivable technical challenge. In my view it's a very long shot.
A small fraction, around 6%, of the world's fossil fuel consumption is not combusted but gets incorporated into various petrochemical products like plastics. These relatively stable materials can lock up their carbon content for quite long periods. But not forever. The technical challenge for substitutes is probably greater than for energy applications.
Energy comes in many largely interconvertible forms – heat, mechanical, electrical, chemical, etc. Electricity is generally regarded as the most desirable and useful of these. Electricity doesn't occur "naturally" (with minor exceptions like lightning). It is produced, or generated, from natural sources via one or more conversion steps. Some produce CO2, all result in energy losses. Properly calculated the sum of all those CO2 emissions makes up the "life-cycle emissions" for that technology. The smaller that sum the "cleaner" or "greener" that electricity is.
Advertisement
The choices for clean energy in Australia have been converging towards clean electricity produced from solar, wind and hydroelectric energy. These are classified as "renewables" because in principle their energy sources, solar radiation, wind and rainwater captured in rivers and dams, are being continuously renewed and unlimited, in contrast to the Earth's mineral resources.
These renewables are the focus of Australian energy policy. Elsewhere other significant clean sources are exploited, like nuclear energy and bioenergy. Nuclear is illegal in Australia. Bioenergy is a small contributor, 1.2% of electricity last year from multiple small sources.
There is occasional debate over nuclear energy's clean credentials. The debate is political. Scientifically, as measured by CO2 emissions, nuclear energy is clean.
So in Australia the energy transition has come to mean the progressive replacement of today's energy systems by clean electricity from the three dominant and popular renewables; solar electricity (almost always via photovoltaic technology), wind electricity and hydroelectricity. Progress of the energy transition is routinely quantified in terms of the metric "% renewables". It measures the proportion of total electricity generation over a given period sourced from the three approved clean sources.
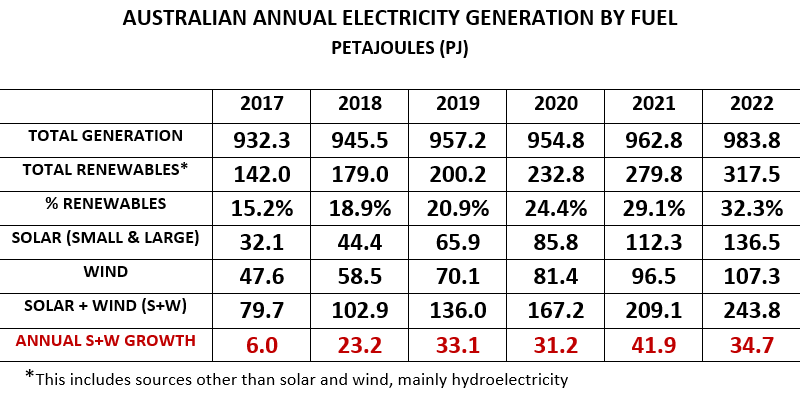
To see how well the "% renewables" metric conveys progress we must look at data for energy production (not power, which measures rates of output or usage, not quantities). For conveying the overall picture it's best to use the larger units for electrical energy, like terawatt-hours and petajoules (1 TWh = 3.6 PJ), as in the common energy statistics compilations. This table uses data from the official publication Australian Energy Update.
Advertisement
The driver of clean energy growth is mainly addition of new capacity in solar and wind electricity generation. The bottom line of the table shows annual energy increments produced by that expansion.
I have previously published a similar analysis. The above expanded table, with two more years, confirms the previous conclusion. When expressed in energy units clean energy growth looks slow; over the last four years annual solar + wind output seems to be reaching a growth limit around 35 PJ per annum. In contrast growth of "% renewables" looks relatively fast, doubling over the five-year period.
Another source of electricity statistics is the OpenNEM website. That's where AEMO, the Australian Energy Market Operator, publishes in real time energy source and generation data for the National Electricity Market. The NEM represents the electricity supply into Australia's large east coast grid, presently comprising around 83% of the national supply. OpenNEM is popular with energy analysts.
Discuss in our Forums
See what other readers are saying about this article!
Click here to read & post comments.
9 posts so far.

 reddit this
 Seed Newsvine
 StumbleUpon
