Energy authorities assure the Australian public that renewables are cheapest, solar and wind energy are growing very rapidly, and the transition from fossil fuels to clean renewable is racing ahead, “unstoppably” in the jargon of enthusiasts.
On the other side of the coin, electricity prices keep rising, our electricity supply still relies heavily on fossil fuels, and voters in the forthcoming election hear about Coalition promises to expand the gas supplies needed to maintain electricity security and costs. So there are some headwinds.
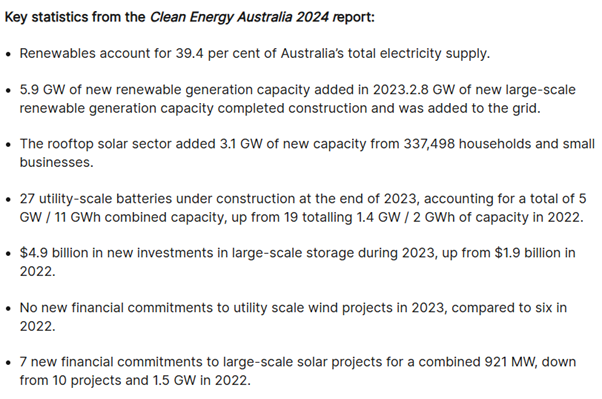
Renewables remain popular. Few realise how that popularity relies on intense campaigning by governments, the renewables industry, and a range of dedicated advocates in institutions, the media, and the energy industry, as well as in universities and other professional bodies such as CSIRO. Propaganda? Let’s look deeper. Here’s a screenshot from a recent (2024) report of the Clean Energy Council, the peak body for the clean energy industry in Australia.
Advertisement
That’s quite a list of good news, but alone it tells us little.
Here’s another list of worldwide good news from various clean energy sources. One senses the hype, but context is still lacking:
- The clean energy industry is irrepressible, with some of the country’s largest wind and solar projects coming online and rooftop solar continuing its record-breaking run (Australia).
- Massive expansion of renewable power opens the door to achieving the global tripling goal (world).
- The world added 50% more renewable capacity in 2023 than in 2022, and the next five years will see the fastest growth yet (world).
- The world’s capacity to generate renewable electricity is expanding faster than at any time in the last three decades (world).
- The fraction of new global generation capacity provided by solar and wind in 2024 was 85%; the corresponding figure for Australia was 99% (world).
- The game is up – wind and solar photovoltaics have won the race. It is a lay-down misère (Australia).
The big picture is pretty clear. Renewables, mainly solar and wind, are booming; the mood is buoyant.
One caution is needed. All or most of the good news refers to power and capacity, not energy. It makes a difference, as I show below.
Advertisement
The table below, in energy units, puts a quite different perspective on the growth performance of clean energy in Australia. It shows Australia’s annual electricity generation output, by fuel, for the seven years to 2023. That’s the last year of energy statistics available right now. (Energy data tend to appear slowly. 2024 data will only arrive around June 2025.) The bottom line shows, in red, the annual growth increments. The energy units are petajoules, which offer convenient numerical values for an economy the size of Australia. The terawatt-hour (TWh), perhaps a more familiar unit, would also suit. 1 TWh = 3.6 PJ.
|
|
2017 |
2018 |
2019 |
2020 |
2021 |
2022** |
2023 |
|
Total Generation |
932.3 |
945.5 |
957.2 |
954.8 |
962.8 |
982.4 |
983.1 |
|
Total Renewables* |
142.0 |
179.0 |
200.2 |
232.8 |
279.8 |
315.0 |
343.1 |
|
% Renewables |
15.2% |
18.9% |
20.9% |
24.4% |
29.1% |
32.1% |
34.9% |
|
Solar (Small & Large) |
32.1 |
44.4 |
65.9 |
85.8 |
112.3 |
135.0 |
162.0 |
|
Wind |
47.6 |
58.5 |
70.1 |
81.4 |
96.5 |
107.3 |
114.8 |
|
Solar + Wind (S+W) |
79.7 |
102.9 |
136.0 |
167.2 |
209.1 |
243.4 |
276.8 |
|
Annual S+W Growth |
6.0 |
23.2 |
33.1 |
31.2 |
41.9 |
34.3 |
33.0 |
*This includes sources other than solar and wind, mainly hydroelectricity
** 2022 data revised based on 2024 Statistical Review of World Energy
Discuss in our Forums
See what other readers are saying about this article!
Click here to read & post comments.
13 posts so far.

 reddit this
 Seed Newsvine
 StumbleUpon
