The cats just can’t keep out of the climate pigeons.
First, earlier this year two Harvard researchers, Willie Soon and Sallie Baliunas, showed that, contrary to an influential paper published in 1998 in Nature by Michael Mann, Ray Bradley and Malcolm Hughes (MBH), the Mediaeval Warm Period (about 1100 to 1450) and Little Ice Age (about 1600 to 1900) were probably global in their influence. This fact argued against late-20th century climate warming being particularly unusual in rate or magnitude.
Second, at the recent World Climate Conference in Moscow, Vladimir Putin’s science advisor Yuri Izrael commented that "all the scientific evidence seems to support the same general conclusions, that the Kyoto Protocol is overly expensive, ineffective and based on bad science".
Advertisement
And now Canadian statistical expert Steven McIntyre, and economics professor Ross McKitrick (MM), have combined their skills to try to reproduce one of the fundamental graphs which was used by the Intergovernmental Panel on Climate Change when, in 2001, the Panel concluded that late-20th century warming was proceeding at a dangerously enhanced rate. Astonishingly, MM have shown that one of the key papers on which the IPCC relied is fundamentally flawed.
The paper, the same one by MBH which has already had doubt cast on it by the work of Soon and Baliunas, included a subsequently much-cited summary graph of climate records over the last 600 years. For the period up to about one hundred years ago, the graph was based on indicators such as fossil coral growth rings and tree rings. When the climate is warm these organisms grow more and thus exhibit wider rings, and when it is colder their growth rings are narrower, which allows measurements across the annual rings to be used as a proxy-temperature curve.
MBH used complex statistical averaging methods to combine no fewer than 112 such proxy records into an inferred climate curve for the period 1400-1900. Controversially, for the period between 1902 and 1980 they then spliced on an averaged curve of actual thermometer temperature measurements. The result was a combined curve which showed little evidence of either the Mediaeval Warm Period or the Little Ice Age (two climatic periods which earlier researchers had shown to be widespread, at least in the northern hemisphere) and a dramatic upturn to higher temperatures after 1900 and continuing to 1980. Thus was born the famous “Hockey Stick” curve of recent climate change.
Though it was immediately adopted as the received truth by global warming lobbyists, many scientists were sharply critical of the conclusions of MBH. Critics pointed out that the graph was based on datasets which were heavily manipulated statistically and, in combining at the year 1902 two datasets of different derivation, that MBH had transgressed good statistical practice. In addition, there is abundant evidence that 600 years is a ridiculously short period of time over which to make judgments about climate change.
In their attempt to replicate the MBH graph, MM used a data summary which was provided to them, on request, by Professor Mann himself. They discovered that this dataset and the published conclusions based upon it contained no less than nine types of fundamental data-processing or statistical error.
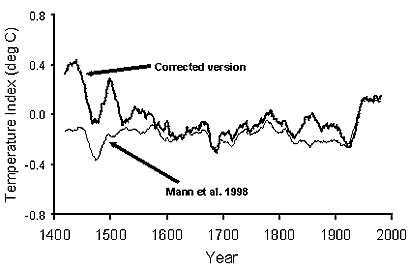
Going back to the original data sources wherever possible, MM painstakingly reassembled an error-free data set as close as possible to the one specified in the original MBH paper. Then, using the same statistical techniques as MBH, they recompiled the 1400-1980 temperature curve.
Advertisement

The result is dramatic. Both a late Mediaeval Warm Period and the Little Ice Age are well shown in the new, corrected graph, and the 20th century temperature rise is seen in proper perspective to lie well within the bounds of historic temperature change. In particular, recent temperatures still fall well below those of the climatic optimum which occurred shortly after 1400.
Hell hath no fury like a Professor scorned, so as could have been predicted, a dogfight has now erupted over whether MM have used the correct data and techniques in their re-analysis. In an initial response to the criticism, Mann has asserted that the dataset which he provided to them is not the same dataset he used in his Nature paper, and contains errors. Such a response does not inspire confidence in Mann’s other work, and in any case, MM used for their analysis a recompiled, accurate dataset.
This article was first published in The Australian Financial Review on 3 November 2003.
Discuss in our Forums
See what other readers are saying about this article!
Click here to read & post comments.
2 posts so far.