It is important to understand that such variation does not reflect different rates in the incidence of disability but instead indicates differences in processes of identification, categorisation and enrolment. These are themselves affected by policy design, resource allocation approaches and practices of assessment and identification used in schools.
There are, however, additional pressures upon the latter and governments considering issues like “performance pay” for teachers need to consider how to go about such initiatives without further incentivising disability diagnosis.
We are aware of a school district elsewhere where teachers received salary loadings for the number of special educational needs students in their classrooms. Not surprisingly the incidence of diagnosis continued to escalate.
Advertisement
Some might wonder why the increase in diagnosis is a problem. Looking again at what has happened in NSW over the last 15 years may provide some indication. (The NSW Department of Education is by far the most transparent in this respect with extensive statistical information made available for public scrutiny. Similar phenomena have been noted in other states but there is limited data available for analysis. This is certainly one area where improvement could be made. The US has national data banks which enable sophisticated, independent research.)
Since the early 1990s, the proportion of students with disabilities enrolled in special schools (SSPs) has remained relatively steady, while the number of students in support classes (SCs) has risen slowly (see Figure 1 below). By far the greatest increase has been in students with a disability enrolled in regular classes (SWD Reg).
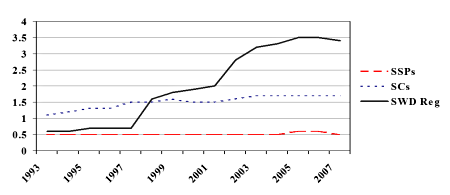
Figure 1: Trends in enrolment of students with disabilities in regular classes (SWD Reg) compared to enrolments in schools for special purposes (SSPs) and support classes (SCs) 1993-2007, calculated as a percentage of total enrolments in NSW government schools
But, if the population in segregated settings (for example, special schools and support classes) have not been decreasing, then where are the students representing such rapid growth in disability diagnosis coming from?
There has been movement in the placement of students with disabilities but, in the main, these shifts have occurred within segregated populations. At the same time, the number of children in regular classes with a diagnosis of disability eligible for Funding Support has increased exponentially.
Efforts to desegregate appear to have been offset by a flow from the other direction due to segregation within the mainstream itself; particularly with respect to the exclusion of children with emotional or behavioural difficulties. Disaggregation of state-wide statistics reveals considerable socio-economic and geographical variance.
Advertisement
Educational disability: where higher standards meet lower thresholds
At the same time that the inclusive education movement has influenced policy and practice in NSW, the academic standard that students are expected to achieve has also risen markedly.
From the late 1970s, only one third of NSW government school students completed 12 years of schooling. That figure rose to 40 per cent in 1987, climbing to 60 per cent after the economic recession of the early 1990s (NSWHealth, 2004, p. 1).
Now at about 68 per cent, the senior school retention rate is a tangible indicator of how much contemporary schools have had to change in order to accommodate a large number of students who, in times past, would have left for jobs in the unskilled labour market. Global economic networks with attendant shifts of sites for production and service have transformed this option for the concealment of schooling failure.
This piece is extracted from a research paper that will be presented at the 2008 American Educational Research Association in New York in March 2008.
Discuss in our Forums
See what other readers are saying about this article!
Click here to read & post comments.
2 posts so far.

 reddit this
 Seed Newsvine
 StumbleUpon
