As well as in Chapter 2 it appeared in the Summary for Policymakers and the “Synthesis Report” of the TAR. Environmentalists and the media relentlessly promoted it, as proof of human causation of global warming. However it had never been independently verified and was fatally flawed.
As we do not have thermometer readings for long ago, historic temperatures are estimated using “proxies” that have some feature that is considered a good indicator of temperature and can be dated. For example, the age of trees can be dated by counting rings on living trees and matching patterns on dead trees. In some places evidence is found of ancient tree lines at higher altitudes than trees presently grow, suggesting it was once warmer. The variation in tree ring width and density can in some circumstances follow local temperatures quite closely but in others less well and even inversely. In this and other areas climate scientists “cherry pick” data series, and techniques that tell the story they want.
At a recent CIRES meeting, Gerald North stated that “cherry picking” is a legitimate method in palaeoclimatology. He said because one is looking for a certain, elusive “signal” from the noise, that’s the only way to find the data.
Advertisement
This is an appropriate juncture to consider the “consensus of thousands of scientists” so often mentioned in the media. The chairman of the IPCC said the Fourth Assessment Report (AR4) was the work, rather than consensus, of 2500+ scientific expert reviewers, 800 contributing authors and 450 lead authors drawn from 130 countries.
The evidence from AR4 is that the expert reviewers have little effect on the controversial issues. WGI Chapter 2 of the TAR lists just ten authors. They also list 136 “contributing” authors but it is difficult to see how the crucial section on the “hockey stick” could have been written by anyone other than the young Dr Mann with the possible assistance of Dr Briffa and Dr Jones.
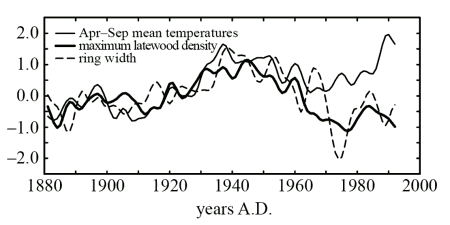
The “divergence” problem as shown by Briffa and Jones in 1998
In the same year as Dr Mann published his “hockey stick” two UK scientists Keith Briffa and Philip Jones with others published a paper entitled “Trees tell of past climates: but are they speaking less clearly today?” with a graph shown above. This paper shows a “divergence” problem after 1960 with many tree ring proxies but was not cited in the TAR although other work by Jones and Briffa was used as corroboration of the “hockey stick” in the graph shown below.
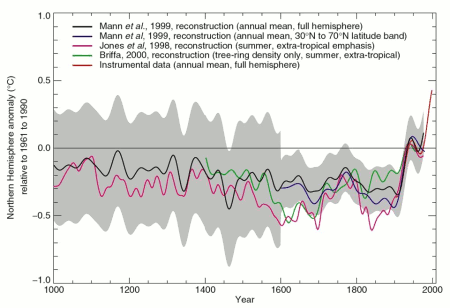
Studies by Mann, Jones and Briffa as shown in the IPCC Third Assessment Report
A fundamental duty of scientists, and advocates of any sort in a civilised society, is that they do not deliberately conceal matters that might weaken their case. If you look carefully at the graph above you can see that Briffa’s curve ends at 1960. However, in the paper it is taken from, it continues much further but falls away from the instrumental (thermometer) curve, which the authors wish to suggest their historic estimates are consistent with.
Advertisement
You should also note that instrumental curve used by Dr Mann was from a 1992 paper of Jones and Briffa. It is only plotted from 1902 both here and in his original papers, whereas the original Jones and Briffa paper shows data back to 1854. When the full data is plotted as shown below, copied from ClimateAudit.org, it is very clear that none of the reconstructions compare well with the known instrumental record and cannot therefore be reliable indicators of historic temperatures.
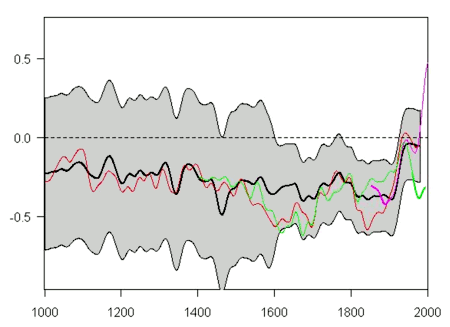
Missing data added to Figure 2.21 in IPCC, 2001 WGI Chapter 2
The “hockey stick” came under immediate attack, but for most it was impenetrable. The determination of Stephen McIntyre and Ross McKitrick finally unravelled it. The chronology of correspondence seeking to obtain full details includes more than one occasion of the removal from the Internet of previously available data. It demonstrated the lengths Dr Mann went to in order to avoid his study being scrutinised.
Discuss in our Forums
See what other readers are saying about this article!
Click here to read & post comments.
79 posts so far.

 reddit this
 Seed Newsvine
 StumbleUpon
