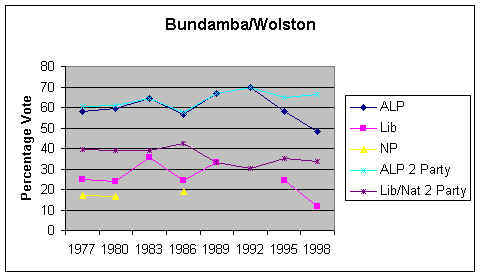
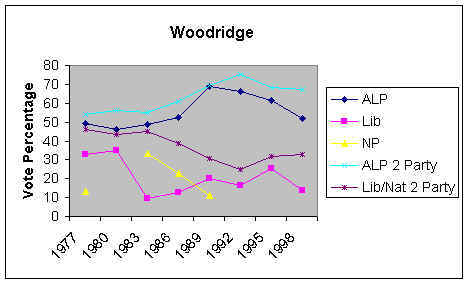
The electors of Bundamba and Woodridge go to the polls this Saturday in an election which will provide a mid-term check on the health of the Beattie Government.
It will also give some clues to the Liberal Party's recovery from its injuries of the last election and whether either the City Country Alliance or One Nation has a pulse.
The following tables have been supplied by David Fraser. The graphs were generated from them.
Advertisement
Readers are invited to make their own predictions of the result and email them to the editor before close of polling Saturday 5th February. The neatest most correct entry may receive a prize.
|
Bundamba/Wolston |
|
First Preferences (%) |
Two-Party Votes (%) |
|
|
ALP |
Lib |
NP |
ALP 2 Party |
Lib/Nat 2 Party |
|
|
1977 |
58.2 |
24.8 |
17 |
60.6 |
39.4 |
|
|
1980 |
59.4 |
23.8 |
16.8 |
61.2 |
38.8 |
|
|
1983 |
64.3 |
35.7 |
|
64.3 |
38.8 |
|
|
1986 |
56.6 |
24.4 |
19 |
57.8 |
42.2 |
|
|
1989 |
66.9 |
33.1 |
|
66.9 |
33.1 |
|
|
1992 |
69.8 |
|
|
69.8 |
30.2 |
|
|
1995 |
58.1 |
24.5 |
|
64.8 |
35.2 |
|
|
1998 |
48.2 |
11.9 |
|
66.2 |
33.8 |
(Notional)
|

|
Woodridge |
|
First Preferences (%) |
Two-Party Votes (%) |
|
|
ALP |
Lib |
NP |
ALP 2 Party |
Lib/Nat 2 Party |
|
|
1977 |
49.4 |
32.9 |
13.3 |
54.1 |
45.9 |
|
|
1980 |
46.3 |
35 |
|
56.4 |
43.6 |
|
|
1983 |
48.9 |
9.4 |
33.6 |
55 |
45 |
|
|
1986 |
52.3 |
12.6 |
22.7 |
61.1 |
38.9 |
|
|
1989 |
68.7 |
20 |
11.2 |
69.5 |
30.5 |
|
|
1992 |
66.2 |
16.2 |
|
75.2 |
24.8 |
|
|
1995 |
61.6 |
25.5 |
|
68.1 |
31.9 |
|
|
1998 |
51.7 |
14 |
|
67.3 |
32.7 |
(Notional)
|
Advertisement

Notes:
- Results in 1977, 1986 and 1992 occurred after a redistribution.
- Two Party Preferred results in 1998 are notional because One Nation ran second in these seats, not the coalition. The result has been adjusted using assumptions about how the One Nation vote would have been redistributed rather than the Liberal Party vote.
- One Nation's first preference vote in Bundamba in 1998 was 34.26%, and it received 43.8% of the two party preferred vote.
- One Nation's first preference vote in Woodridge in 1998 was 28.39%, and it received 36.5% of the two party preferred vote.
Discuss in our Forums
See what other readers are saying about this article!
Click here to read & post comments.