"Canada is warming at roughly double the global average rate," according to scientists at Environment and Climate Change Canada(ECCC). But it looks like this claim, regularly repeated by politicians and media across the board, is yet another example of made up evidence to support a politically correct narrative. And, given that Canada represents such a large fraction of global land surface area, one naturally wonders if the world is actually warming at anything like the rate we are told it is.
A new report demonstrates that the data ECCC has been relying on may be hopelessly corrupted by fundamental mistakes that are responsible for almost all the supposed warming. Rather than being the poster child for global warming, Canada may actually be the latest example of why the public increasingly do not believe anything we are told by governments about climate change.
Scientists can certainly make errors when analysing data, but sometimes, instruments or other effects can lead to skewed data that is more difficult to detect. When it comes to climate change, such errors can have devastating consequences since severe climate change policies based on flawed studies not only affects businesses, but all citizens who are forced to pay for "climate action" and costly and unreliable alternative energy technologies.
Advertisement
On December 23rd, the report "Artificial stepwise increases in homogenized surface air temperature data invalidate published climate warming claims for Canada" was released by Dr. Joseph Hickey, a data scientist with a PhD in Physics (Complexity Science). The report was published by CORRELATION Research in the Public Interest, a registered not-for-profit corporation based in Ottawa, Canada, regarding what appears to be a significant error in Canada's temperature data from Environment and Climate Change Canada (ECCC), a temperature artifact that does not represent actual warming. This artifact could "be responsible for essentially all of the calculated warming for many Canadian locations over the past six or seven decades." The temperature dataset, the Adjusted and Homogenized Canadian Climate Data (AHCCD), was available to the public and is used for calculating long-term temperature trends in Canada as well as data for global temperature analyses.
Hickey writes that "surface air temperature records are affected by many biasing factors, related to changes to instrumentation, observation methods and procedures, and the environment surrounding the instruments." This means that results published could be skewed to show warming, cooling, or varying trends when none exist. Using a wide variety of temperature monitoring stations, as well as comparing surface air temperatures records with other temperature records from satellites, for instance, will help minimize biased results.
When data from different stations is combined to form long-term temperature records, gradual biases can cause the record to shift upward or downward even if there is no real temperature change. These biasing factors could include factors such as the growth of trees in the vicinity of the thermometer, aging of the thermometer, or other changes to the station's environment. In an attempt to make long-term climate trends meaningful, scientists adjust the data to remove these non‑climatic influences. They also homogenize the records-this means aligning data from different periods so that the dataset behaves as if the station had been measuring consistently all along. If these modifications are not made properly, the effect of these factors "influences the long-term trends calculated from the temperature series in a manner that is not reflective of regional climate variability but rather only the conditions in the local surroundings of the thermometer," Hickey writes.
The AHCCD from ECCC consists of daily minimum, maximum, and mean surface air temperatures from hundreds of stations across Canada. Using this data, various scientists have calculated that the surface air temperature has increased 1 – 2 degrees Celsius over the past six to seven decades. Yet in 1998, a stepwise (sudden) increase of approximately 1 degree Celsius occurred in the temperature record at most stations across Canada. This increase could be responsible for almost all of the claimed warming calculated for Canada over the past six or seven decades. This leads Hickey to conclude that "The reported climate warming of Canada appears to be entirely from a temperature measurement artifact." Hickey also explains, "1998 is the year in which a set of 72 Canadian reference climatological stations were first added to the Global Climate Observing System (Milewska and Vincent 2016)."
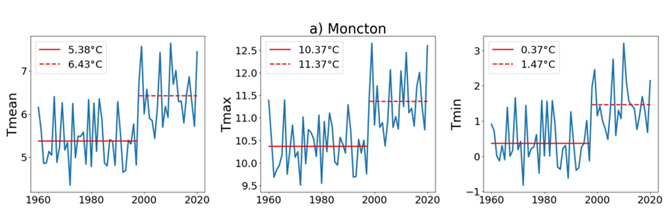
A coincidence that that is exactly when the sudden jump occurred? Not likely.Temperature data from Moncton, New Brunswick is shown below as an example to illustrate the increase
.
Advertisement
Temperature data from Dr. Hickey's report shows the mean (Tmean),maximum (Tmax), and minimum (Tmin) temperatures recorded.
The significant increase in temperature (a "step" in the data) occurred at many other stations throughout the country in exactly the same year. Such a sudden shift only becomes apparent after data from further years are collected, but it needs to be investigated to determine if it is natural or not.
Despite the apparent flaw in their records, Environment Canada essentially dismissed the finding even when alerted to the artifact and other serious problems in their data by Hickey when he was a Bank of Canada employee.
Hickey explains:
I sent figures showing the 1998 step-increase feature in the temperature records of many AHCCD stations to the Environment Canada researchers responsible for creating the AHCCD in emails in June and July of 2021, when I was employed as a data scientist at the Bank of Canada. These emails have since been obtained via an Access to Information (ATI) request to Environment Canada.
…In her responses, Vincent [senior Environment Canada Research Climatologist Dr. Lucie A. Vincent] did not provide an explanation for the 1998 step-increase feature, but rather stated she had 'quickly checked the metadata [data before adjustment and homogenization] for some of the stations' and, on that basis, affirmed that the step-increase feature would not have been caused by the introduction of automated weather stations during the 1990s. In her final response, Vincent stated that '[w]e have not detected a positive shift around 1998 in the annual mean temperature of the selected stations due to automation or any other non-climatic causes' and that '[t]his shift [the 1998 step-increase feature] identified visually when the time series is focused on the 1960-2020 period is probably due to climate variability only.'
"Probably?" So, Canada is spending hundreds of billions of dollars largely based on data that the government scientist most involved in its generation can only say is "probably" indicative of real warming? Something she confirmed in part through "quickly checking the meta data." And, removing that questionable step change results in practically no real warming at all?Showing the map below in his report, where blue circles represent locations of cooling, and red warming, Hickey points out: "If anything, the two-decade trend in annual average temperature series for many AHCCD stations is negative post-1998."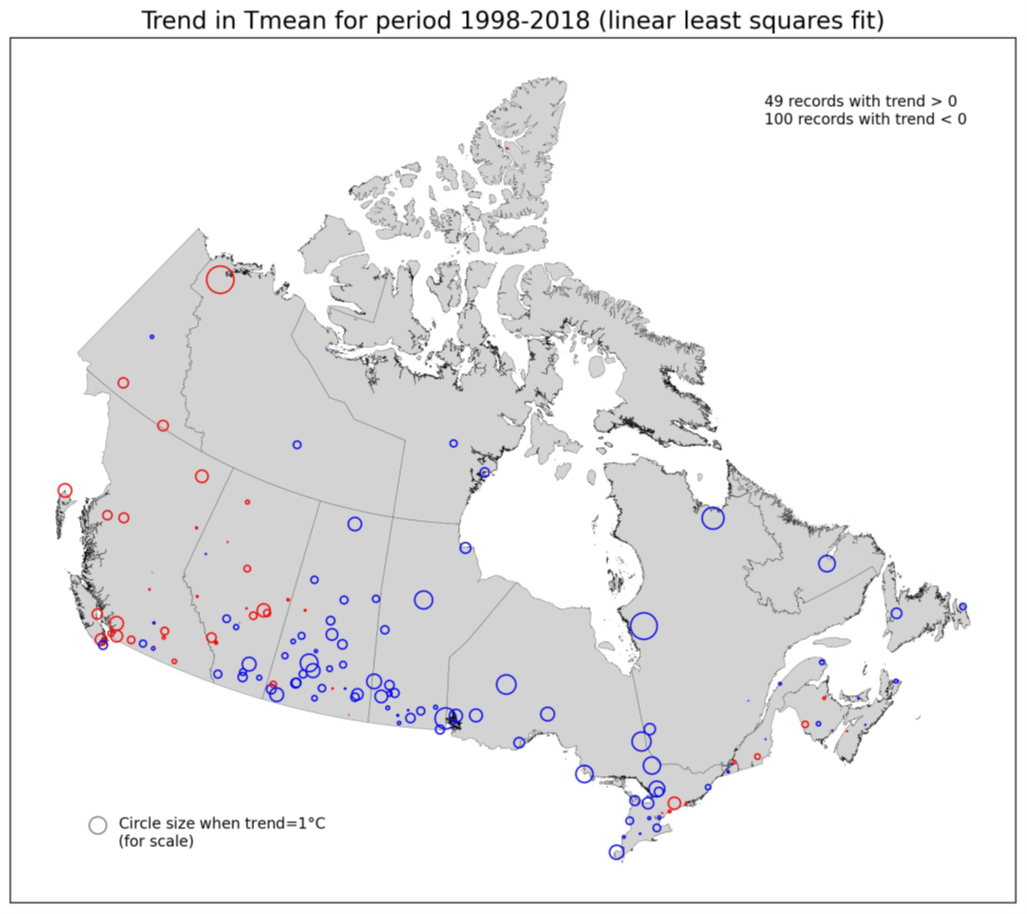
Citing numerous references from the scientific literature, Hickey explained in detail to Vincent in follow-up emails that the sharpness of the temperature increase and its magnitude indicate that it is notdue to real climactic change. He also laid out a detailed analysis of potential sources of the artifact in his report, which could include land use changes and instrumentation changes. Both of these could easily cause a 1-degree shift in the temperature data. Moreover, he explained, "there are no other similar large and geographically widespread discontinuities in the AHCCD dataset at other years."
Meaningfully, Hickey concludes in his Dec 23rd report (my bold):
The 1998 step-increase feature in the annually-averaged temperature time-series for many Canadian stations was therefore left essentially unaddressed by Environment Canada, and remains in place in the AHCCD dataset to this day, including in the 4th generation of the data,...
Hickey was not the only Bank of Canada employee to find fault with ECCC's temperature data. He writes:
On December 7, 2020, Bank of Canada Economist Julien McDonald-Guimond sent an email to Environment Canada researchers with an inquiry about the 2nd generation AHCCD daily temperature records, noting he had found some cases in which the daily minimum temperature (Tmin°) was greater than the daily maximum temperature (Tmax°) for the same day and for the same AHCCD station.
In fact, there were more than 10,000 instances of days for which the daily minimum temperature was greater than the daily maximum temperature, in the 2nd generation of the AHCCD. Hickey writes (my bold):
McDonald-Guimond sent a second email on December 9, 2020 with an attached table listing the instances of Tmin° > Tmax° that he had found…The attachment to McDonald-Guimond's December 9, 2020 email, which Environment Canada's Access to Information office initially failed to include in its release, was eventually provided...McDonald-Guimond's table contains 10,159 instances of daily temperature records with Tmin°>Tmax°. Affected records occurred in all Canadian provinces and territories.
A histogram of the differences Tmin° – Tmax° for the 10,159 instances shown in McDonald-Guimond's table is shown in Figure 10 [below].
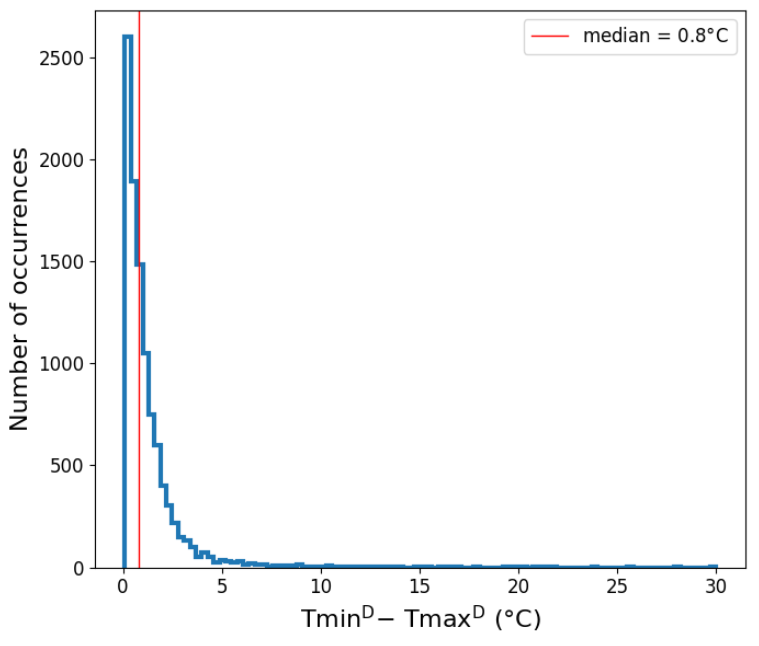
For the 10,159 instances, the median difference between Tmin° and Tmax° was 0.80°C (vertical red line in Figure 10), the average difference was 1.21°C, and the maximum difference, which was for Cape Dorset, Nunavut, on February 25, 1995, was 30°C." [my bold]
Environment Canada Climate Data Analyst Megan Hartwell replied to McDonald-Guimond on January 13, 2021 that "We [ECCC] were quite surprised by the frequency of the issue you reported, and have taken some time to go through the data carefully."
That ECCC were surprised by McDonald-Guimond's finding is cause enough to worry. But the fact that they now "have taken some time to go through the data carefully" begs the question: didn't they go through the data carefully before releasing it the first time? Hartwell's excuse that the homogenized data has since been updated to a later version, while admitting that "the AHCCD site-page has not been updated yet and does not introduce the third generation…" hardly boosts public confidence.
This situation is far too complicated to be explained fully in a brief article such as this, so I encourage interested parties to read Dr. Hickey's December 23, 2025report and judge for yourself if we can trust ECCC's claim that the increase in Canada's average temperature (a specious parameter to begin with) is anything close to the amounts they claim, and on which the government of Canada is basing multi-billion dollar climate policies.
When this apparent blunder is finally fixed, government scientists should be compelled to publish the corrected results just as prominently as they announced their initial findings. And, in the meantime, we should be grateful that experts like Hickey and McDonald-Guimondare prepared to engage in skeptical inquiry of their government peers about data that has contributed to climate policies that we all pay for.

 reddit this
 Seed Newsvine
 StumbleUpon
