Arithmetic is ideology-free. Ignoring its consequences isn't.
Ben Potter wrote a piece on page 6 of The Australian Financial Review for 6 July 2018 titled Renewables generate 19pc of grid already. He cited a report by 'energy expert' Hugh Saddler. The main messages are, (i) in 2017-18 renewable energy generated nearly 19% of national grid power, and (ii) renewables are on track to meet the Turnbull government's emissions target without the national energy 'guarantee'. Saddler says a higher renewables target is 'absolutely' needed. He says it's the lowest-cost way to reduce emissions nationally, because other sectors don't have electricity's 'easy options'. Really?
The claimed 19% share of 'renewables' generation in the NEM looks plausible. Break that down into two components: (i) 'old' hydro, and (ii) 'new' renewables. 'Old' hydro, like 'old' coal, has been around for ages, concentrated in Tasmania, plus some Snowy 1.0. Snowy 2.0 is still an engineer's expensive wet dream. 'New' renewables comprise mainly wind, solar (large-scale and small), and batteries. Here's two charts.
Advertisement
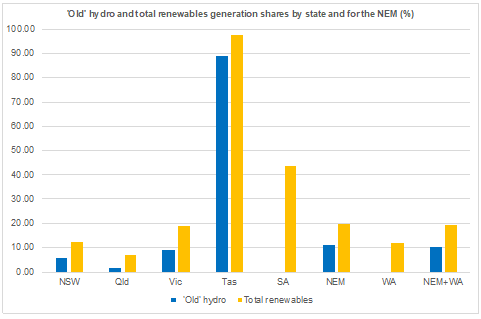
These roughly average current intermittent renewables. The first chart tells us a few things about 'old' hydro:
- By state power generation share, it's concentrated in Tasmania, with small shares in NSW, Victoria, and an even smaller share in Queensland.
- For the NEM, and nationally, it's over half the generation share of all renewables, old and new.
Labelling hydro as a renewable energy source is misleading. To the extent it's 'pumped hydro', and cheap off-peak base-load coal generators pump the water back uphill at night, it's actually coal power.
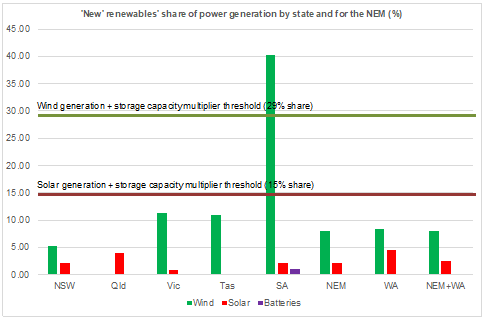
The second chart above illustrates some key features of 'new' renewables:
Advertisement
- South Australia is the wind power generator leader by a long way. To actually deliver reliable power, (as also shown in the first chart), it's still well short of Jay Weatherill's aspirational 75% RET. Victoria and Tasmania come a distant second, with WA and NSW bringing up the rear.
- For solar, WA has the largest share, Qld is next, then NSW and SA. Vic and Tasmania are also-rans.
- NEM-wide, and nationally, wind power is the largest 'new' renewable with over 8% of total power generation. Solar is next. Batteries are very small to date.
There are two horizontal lines in the second chart. These tell us about power costs (and reliability?):
- The green line shows the share of wind power above which multiplied generation and the need for multiplied battery storage is required for reliable power. SA, alone, is way above this threshold.
- The red line shows the share of solar power above which multiplied generation and the need for multiplied battery storage is required for reliable power. No state is above this - yet.
In the spirit of the NEM, we could look at renewables generation across groups of states, provided inter-connector facilities allow load-sharing between them. At present, the NEM can be broken into two regions: (i) the Vic/Tas/SA region, and (ii) the NSW/Qld region. (WA is unconnected.) The chart below illustrates renewables shares, using state power generation-weighted averages, for these two regions.
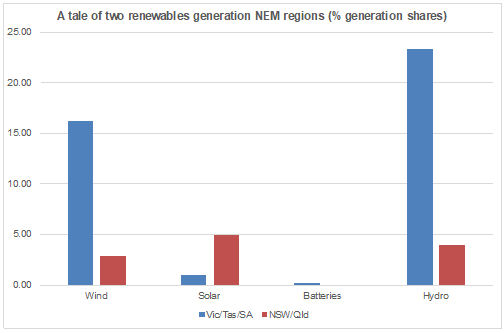
The chart shows these two NEM regions have very different renewable energy characteristics:
- The Vic/Tas/SA region is much more wind and hydro-dependent than the NSW/Qld region (over 16% and over 23%, respectively). The NSW/Qld region averages well under 5% for both.
- The NSW/Qld region depends more on solar power, but only with about 5% of generation.
- Neither region, on average, exceeds the solar (15%) or wind (29%) share thresholds above which multiplied generation and storage capacity is needed for reliability. On wind, Vic/Tas/SA is closing in.
- Reliability demands interstate inter-connectors themselves have (i) sufficient capacity, (ii) reliability, and, (iii) connected states always agree to keep them open, for regions to work in a NEM-type way.
- In 2016, SA and Tasmania, and the relevant inter-connectors, clearly failed this test.
Some may argue these charts show surging power prices in Australia have not been due to increasing renewables generation shares because, regionally at least, the renewables capacity 'multipliers' aren't (yet) exceeded.
This is tendentious. It's also incorrect.
In particular, the effect of preferential treatment for wind and solar power reduced market access by base-load power generators, raising their costs to stay in operation. The incessant political 'jawboning' against new investment in base-load power capacity, the increasing investment/sovereign risk that caused, the publicity given to lenders not willing to finance such investments, and the withdrawal of existing base-load supply, all helped increase power prices as base-load capacity disappeared.
All of these influences are directly attributable to Australia's renewable energy policy.
Once solar and wind thresholds are breached (as now for wind in SA), reliability imperatives demand increasing multiplied wind and solar generation capacity, almost matched by increasing multiplied capacity in storage. If we want reliability, this is unavoidable due to solar/wind intermittency. See chart below.
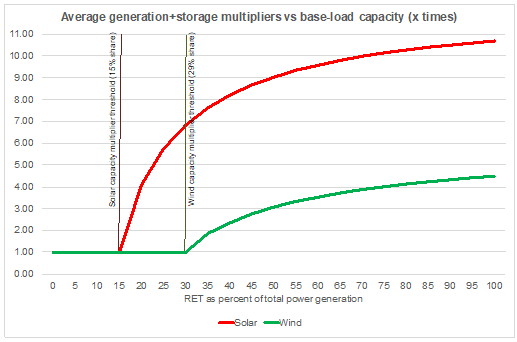
These average capacity multipliers will also multiply total costs of ensuring reliable power even as $/MWh renewables generation costs fall. The marginal capacity multiplier for solar, once solar accounts for more than 15% of generation, is 12.33 times. The corresponding multiplier for wind, once wind accounts for more than 29% of generation, is 5.90 times. These estimates are based on official data for SA in 2016-17.
Solar and wind power are making the power grid more and more intermittent. If we want reliability, this is adding cost increases via shrinking base-load power shares already. As the share of renewables exceeds the multiplier thresholds noted above, reliability will require even more cost increases as we shift further from current base-load power to multiplied generation and storage capacity for intermittent renewables.
Our RETs are a detonator set to trigger a larger power cost explosion. They are intended to skew power supply towards renewables, and away from everything else. They multiply required renewables generation and storage capacity to match reliability of fossil fuel power they replace, exploding power costs. Costs are already increasing, as intended, as RETs destroy the economics of fossil fuel base-load power options more generally. As fossil fuel base-load is confined to shorter supply hours, its viable power costs must rise.
Is this what we want? Apparently so. We've designed, made, and set off this power cost bomb ourselves. Global emissions reductions from our efforts will be invisible. Why inflict this damage on ourselves?
Saddler says the electricity sector has 'easy options' for (global?) emissions reduction via increasing RETs. Really? I'd hate to see the affordability and reliability consequences of his list of hard electricity options.

 reddit this
 Seed Newsvine
 StumbleUpon
