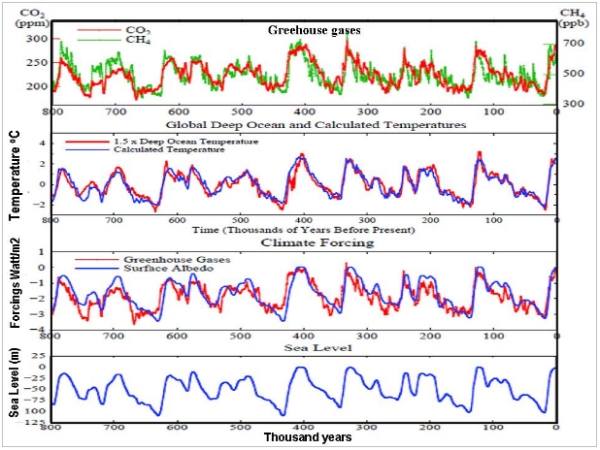
Figure 1.
Advertisement
CO2, methane, temperatures based on deep ocean measurements, calculated temperatures, greenhouse gas forcing, surface albedo and sea level changes over the past 800,000 years. From Hansen and Sato, 2011 [2].

Figure 2
Past global temperatures relative to mean Holocene temperature, based on ocean core records, with temperature change amplified by factor 1.5 (relative to Vostok-based estimates). Red arrow in upper diagram indicates temperature rise since 1750 consistent with the rise in atmospheric energy levels at 1.7 Watt/m2, indicating a committed rise of +1.2oC, or ~ +2.4 oC rise without aerosol masking effects.
Advertisement
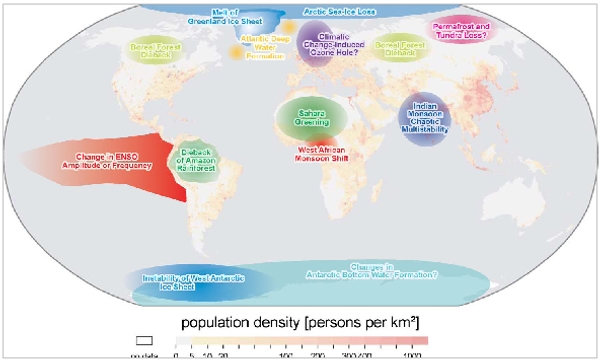
Figure 3.
Map of potential tipping elements in the climate system, overlain on global population density. Subsystems indicated could exhibit threshold-type behaviour in response to anthropogenic climate forcing, where a small perturbation at a critical point qualitatively alters the future fate of the system (Lenton et al. 2008 [3]). http://researchpages.net/esmg/people/tim-lenton/tipping-points/
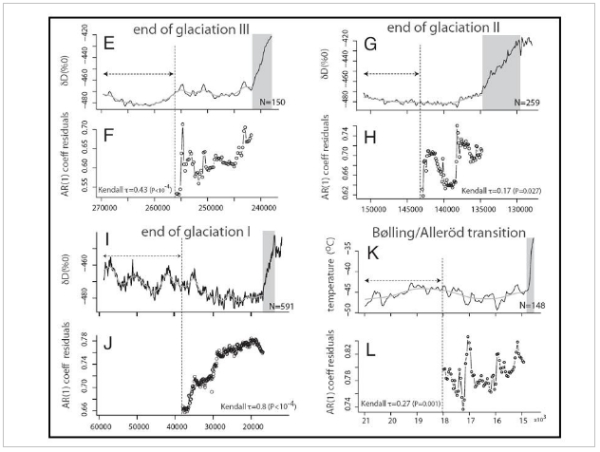
Figure 4
Reconstructed time series of abrupt climate shifts in the past. The arrows mark the width of the moving window used to compute slowness. The smooth grey line through the time series is the Gaussian kernel function used to filter out slow trends. Dakos et al.,2008 [4]. http://www.pnas.org/content/105/38/14308
Discuss in our Forums
See what other readers are saying about this article!
Click here to read & post comments.
17 posts so far.

 reddit this
 Seed Newsvine
 StumbleUpon