The history of the Earth’s atmosphere indicates the extreme sensitivity of climate to even minor compositional changes of the greenhouse gases (CO2, methane, nitric oxide, ozone), which affect the carbon cycle and oxygen cycle which, in turn, control life.
Major changes in the CO2 and methane composition of the atmosphere since the 18th century threaten to shift the state of the Earth’s atmosphere to conditions similar to those of 2.8 million years ago (mid-Pliocene) and 18 million years ago (mid-Miocene) thermal peaks.
The cumulative nature and centuries to millennia-scale atmospheric residence time of CO2 is tracking towards the natural boundary between the current interglacial climate state and a transient greenhouse climate state, defined by paleoclimate history above a level equivalent to 500ppm CO2 (Zachos et al. 2001. Trends, rhythms, and aberrations in global climate 65 Ma to present. Science). The effects of this rise are evidenced by contemporaneous melting of mountain glaciers, Arctic Sea ice, Greenland and West and East Antarctica ice sheets and the increasing rate of sea level rise.
Advertisement
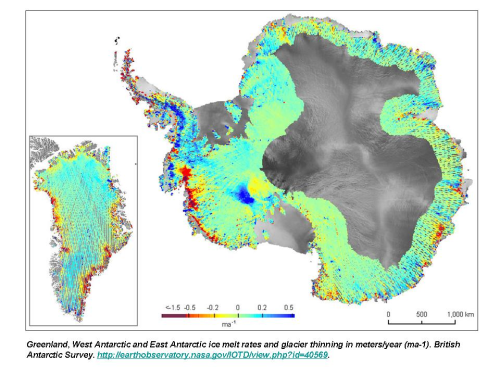
Figure 1. Greenland, west Antarctica and East Antarctica ice melt rates and glacier thinning in metres per year (ma-1). British Antarctic Survey. The red and purple areas represent ice melting at rates larger than 0.5 metres per year. Grey areas have no ice melt data.
Global warming by +0.8 degrees C since 1750, plus +0.5 degrees C currently masked by sulphur aerosols, with further effects of ice albedo (reflection) loss not yet accounted for, has surpassed the temperature rise associated with the last interglacial (Emian: 124,000 years ago; ~ +1 degree C; ~ +4 to 6 metre sea level rise) (Figs 2 - 4).
At 460ppm CO2-e (a value including the CO2-equivalent radiative forcing of methane) the energy level of the atmosphere exceeds that of the mid-Pliocene (2.8 million years ago; CO2 ~400ppm, +2 to +3 degrees C; sea levels +25±12 metres). As CO2 and temperatures rise they track towards levels reached in the mid-Miocene ~13-15 million years ago (CO2 levels near-500ppm; deep sea temperature 4.0 - 4.4 degrees C) and the Oligocene (CO2 ~650ppm; deep sea temperatures ~5 degrees C; sea levels tens of metres higher than at present).
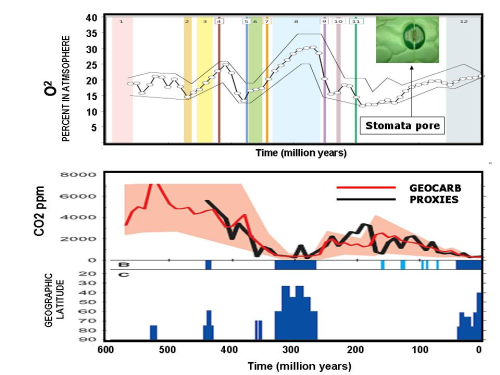
Figure 2. Variations in Oxygen and CO2 through the last 600 million years of Earth evolution. Note the concomitant decline in CO2 and increase in O2 during ice ages, and the opposite relations during greenhouse phases of Earth history. Oxygen plot after Berner et al. 2007 [6]. CO2 plot after Royer 2004. The blue bars represent glacial periods, with heights corresponding to the latitudes the ice sheets reached.
Advertisement
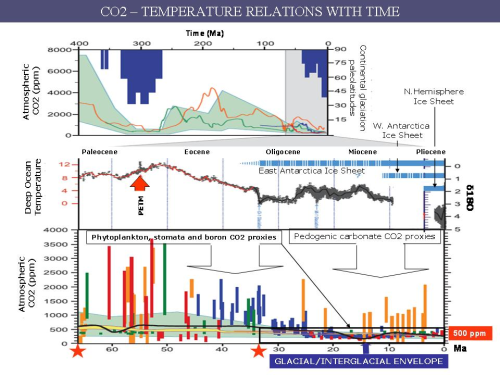
Figure 3. Paleo-CO2 and paleo-temperature plots for the periods 400 million year to the present and 65 million years to the present. Note the upper ~500ppm CO2 boundary between glacial and greenhouse Earth climate conditions. IPCC-2007 Chapter 6.
Top: Atmospheric CO2 and continental glaciation 400 Ma to present. Vertical blue bars mark the timing and paleo-latitudinal extent of ice sheets. Plotted CO2 records four major proxies.
Middle: Global compilation of deep-sea temperatures based on 18O of fossil plankton from 40 Deep Sea Drilling Program and Ocean Drilling Program sites.
Bottom: Detailed record of CO2 for the last 65 Million years. Estimates based on soil nodules have high uncertainty
Discuss in our Forums
See what other readers are saying about this article!
Click here to read & post comments.
8 posts so far.

 reddit this
 Seed Newsvine
 StumbleUpon