A couple of weeks back a one-time hero of mine, Dr Helen Caldicott, had a piece on On Line Opinion called “The medical and economic costs of nuclear power”. She was a hero of mine back in my anti-nuclear days, and I've discussed elsewhere my change of position to anti-uranium mining, while supporting a type of nuclear fuel cycle involving Integral Fast Reactors which can chew up current nuclear waste, allow the closure of uranium mines, and give us a fighting chance of avoiding dangerous climate change.
Back in my anti-nuclear days, I would have latched on to Caldicott's medical citations with sufficient detail to recall and regurgitate at the slightest opportunity: for example, a German study found increased childhood cancer rates; meta-analysis found increased childhood cancer rates.
But a lot has happened since I first became anti-nuclear as a young student. I've learned much more mathematics, scrutinised many research protocols, and also developed a bit of a nose for the inappropriate use of statistics. So now that I've changed my position on nuclear, my reaction to articles like Caldicott's is to trace claims back to their source.
Advertisement
Evaluating simple statistical claims can take a lot longer than making them, so you'll need a little patience.
We won't deal with all of Caldicott's evidence, but consider in detail the meta-analysis she cites: Baker PJ, Hoel DG. Meta-analysis of standardized incidence and mortality rates of childhood leukemia in proximity to nuclear facilities. Eur J Cancer Care. 2007:16:355-363 . The lead author kindly sent me a copy of the full paper.
First, what is a meta-analysis? Everybody has seen arguments with people citing studies finding for or against some claim, or dismissing a study as small or poorly done. A meta-analysis collects as many studies as it can find on a topic and quantitatively combines them. The word “quantitatively” is crucial.
Here's a simple example which illustrates, in very simple terms, what a meta-analysis is and why they are so important. Imagine you have a bucket with one hundred 20 cent pieces. You get each of 20 friends, one after the other, to take four coins, toss them, record the outcome, put them back in the bucket and publish this as a scientific study (which it is) under the title "Investigation into the bias or otherwise of Geoff's bucket of coins". I'll accept the article in the Journal of trivial research which you can imagine exists with me as the editor.
Now let's pretend everybody gets four heads. Of itself and under the normal conventions used in most research, this isn't statistically significant evidence that the coins in the bucket are biased. Because, even with fair coins, this could happen once in every 16 tests of this kind. So we end up with 20 research papers all claiming not to have found statistically significant evidence of bias in the coins.
There are two basic ways of summarising the state of these bucket studies. First, we just count significant studies. There are none. End of story. We pronounce that the coins in the bucket must be fair since we did a whole heap of studies and none found any significant evidence of bias. You'd be surprised at the people who use this method when it suits them. The second approach is to combine all the results into a meta-analysis and it instantly becomes blindingly obvious that it is highly likely that the coins are biased.
Advertisement
In the real world, combining studies is much tougher and sometimes impossible because researchers don't all use the same methods and the differences can be extreme, but when it is possible then it’s clearly a pretty good way of assessing research.
So, that's a meta-analysis. Studies of the incidence of leukemia near nuclear facilities usually end up with a risk factor. If the study shows that leukemia is more likely near nuclear facilities then the risk factor is above 1. If it is less likely, then the risk factor is below 1. Thus a risk factor of 0.5 means leukemia was half as likely near the reactor than normal. A risk factor of 2 indicates a doubling of risk near the reactor.
Here's two sets of numbers I just made up from a mythical meta-analysis of risks due to reactor proximity:
(A) 1.4, 1.3, 1.1, 2.3, 2.1, 1.6, 0.9; and
(B) 0.4, 1.3, 0.7, 2.0, 1.1, 1.5, 0.9.
In (A), most of the numbers are above 1; when we do the meta-analysis, the result will be above 1 and we can be fairly certain there is something going on near the reactors. Of course the impact may not be due to radiation from a reactor. Maybe some reactors were built on land once used by coal fired power stations. The cheap land draws young families. The coal stations emitted fly ash having a radioactivity exceeding anything found around nuclear reactors and the kids play on contaminated ground. Correlation isn't causation, so while the numbers would provide a reason for further research, they are not conclusive.
In (B), the numbers are all over the shop. Being near a reactor doubles your risk in one case and more than halves it in another study. When the results are combined - and it's a little more complex than just adding and averaging ... don't worry, the statisticians know how to do it - the final figure may perhaps be above one, it may even be statistically significant, but the fact that there is no clear trend in the data should make you cautious about resting any grand claims on it.
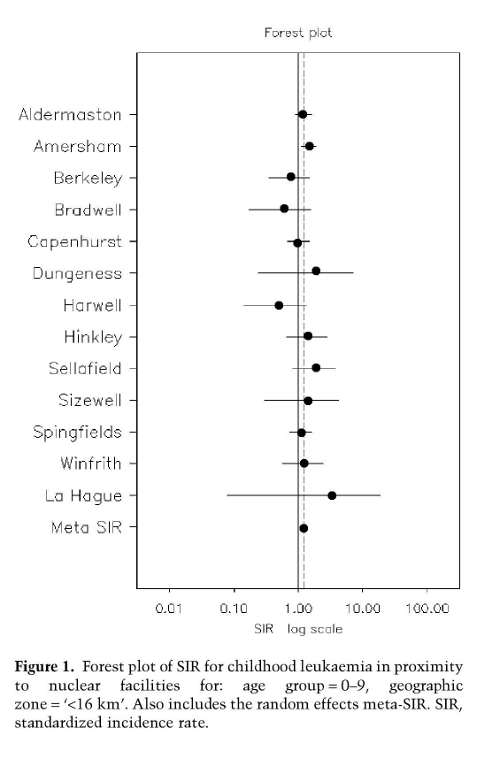
Now here (see below) is an actual set of numbers from the meta-analysis used by Caldicott (with apologies for the poor quality of the PDF to jpg output). It is shown as a forest plot, with blobs instead of numbers. The horizontal lines through the blobs show the 95 per cent confidence interval. If the left end of that horizontal bar is to the right of the 1 line - the line of "no effect" - then the result is statistically significant. Three studies show a reduction in leukemia around plants and while there is a net effect, this would probably disappear without the Hague study. Taken as a whole, the picture is rather less convincing than the net effect cited by Caldicott would indicate.
But there is another way of looking for an impact, if any, of nuclear plants on childhood leukemia.
We could compare the national rates of childhood leukemia in countries with and without nuclear power. If nuclear plants had a big impact and nothing much else caused these cancers, we might expect a discernable difference.
The WHO Globocan database has data on leukemia classified by age and sex in countries around the world. France produces nearly 80 per cent of its electricity with nuclear power stations and the incidence rates of leukemia in 0 to 14-year-olds in the six reporting regions range from 0.9 cases per 100,000 per annum in Bas-Rhin for males through to 5.6 in Isere for females.
In Australia, the rates range from 2.3 for male children in Tasmania, through to 6.8 for females in the ACT. The data in these tables is 1995, but most of the French nuclear plants were operational well before this date and I couldn't find more recent data. These numbers tell us that any effect from nuclear plants is small or zero relative to whatever else is causing these cancers.
Various studies have reported a clustering of childhood leukemia cases, but attempts to pin down the cause, or causes, have been pretty unconvincing. For example, the study linked to in the preceding sentence thought the most likely cause was petroleum processing and distribution network. This analysis suffered some pretty heavy criticism. Later work has found slight clustering in some time periods but not others and drew attention to the difficulties of defining a cluster over time. For example if three children in the same street get leukemia, is it a cluster if the cases are separated by 20 years? The ebb and flow of suburbs and populations makes clustering rather more complex to nail down than appears at first sight.
Most of us have no objections to dental X-rays, CT-scans and a host of other uses of radiation in its various forms. We trust that the scientific understanding of radiation is good enough to rest assured that the little aprons the dentists give us actually work. I could have relied on that same trust to argue that the scientific understanding of radioactivity shows that it is simply impossible for nuclear plants under normal operation to have any impact on childhood leukemia rates. But I've tried in the above article to show that even without such faith, the numbers simply don't add up and don't give any cause for concern.

 reddit this
 Seed Newsvine
 StumbleUpon